In Part 1 I looked at linear regression from the point of view of machine learning and asked the question whether the data was from “An environment that is sufficiently regular to be predictable.”1 The next big question is whether it was worth it in the first place.
Variation explained
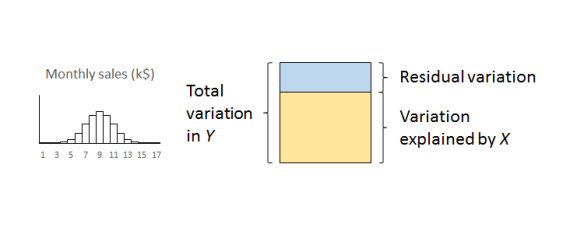
We previously looked at regression in terms of explaining variation. The original Big Y was beset with variation and uncertainty. We believed that some of that variation could be “explained” by a Big X. The linear regression split the variation in Y into variation that was explained by X and residual variation whose causes are as yet obscure.
I slipped in the word “explained”. Here it really means that we can draw a straight line relationship between X and Y. Of course, it is trite analytics that “association is not causation”. As long ago as 1710, Bishop George Berkeley observed that:2
The Connexion of Ideas does not imply the Relation of Cause and Effect, but only a Mark or Sign of the Thing signified.
Causation turns out to be a rather slippery concept, as all lawyers know, so I am going to leave it alone for the moment. There is a rather good discussion by Stephen Stigler in his recent book The Seven Pillars of Statistical Wisdom.3
That said, in real world practical terms there is not much point bothering with this if the variation explained by the X is small compared to the original variation in the Y with the majority of the variation still unexplained in the residuals.
Measuring variation
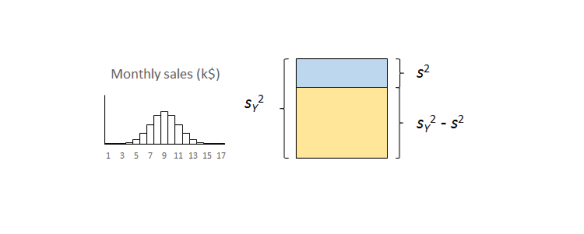
A useful measure of the variation in a quantity is its variance, familiar from the statistics service course. Variance is a good straightforward measure of the financial damage that variation does to a business.4 It also has the very nice property that we can add variances from sundry sources that aggregate together. Financial damage adds up. The very useful job that linear regression does is to split the variance of Y, the damage to the business that we captured with the histogram, into two components:
- The contribution from X; and
- The contribution of the residuals.

The important thing to remember is that the residual variation is not some sort of technical statistical artifact. It is the aggregate of real world effects that remain unexamined and which will continue to cause loss and damage.

Techie bit
Variance is the square of standard deviation. Your linear regression software will output the residual standard deviation, s, sometimes unhelpfully referred to as the residual standard error. The calculations are routine.5 Square s to get the residual variance, s2. The smaller is s2, the better. A small s2 means that not much variation remains unexplained. Small s2 means a very good understanding of the cause system. Large s2 means that much variation remains unexplained and our understanding is weak.

The coefficient of determination
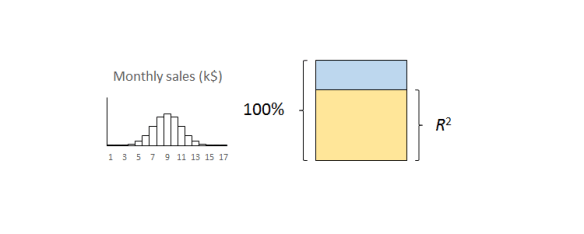
So how do we decide whether s2 is “small”? Dividing the variation explained by X by the total variance of Y, sY2, yields the coefficient of determination, written as R2.6 That is a bit of a mouthful so we usually just call it “R-squared”. R2 sets the variance in Y to 100% and expresses the explained variation as a percentage. Put another way, it is the percentage of variation in Y explained by X.
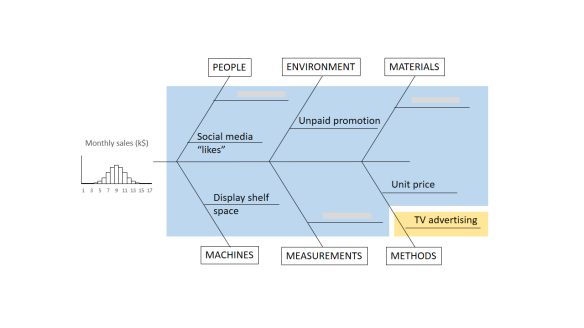
 The important thing to remember is that the residual variation is not a statistical artifact of the analysis. It is part of the real world business system, the cause-system of the Ys.7 It is the part on which you still have little quantitative grasp and which continues to hurt you. Returning to the cause and effect diagram, we picked one factor X to investigate and took its influence out of the data. The residual variation is the variation arising from the aggregate of all the other causes.
As we shall see in more detail in Part 3, the residual variation imposes a fundamental bound on the precision of predictions from the model. It turns out that s is the limiting standard error of future predictions
Whether your regression was a worthwhile one or not so you will want to probe the residual variation further. A technique like DMAIC works well. Other improvement processes are available.
So how big should R2 be? Well that is a question for your business leaders not a statistician. How much does the business gain financially from being able to explain just so much variation in the outcome? Anybody with an MBA should be able to answer this so you should have somebody in your organisation who can help.
The correlation coefficient
Some people like to take the square root of R2 to obtain what they call a correlation coefficient. I have never been clear as to what this was trying to achieve. It always ends up telling me less than the scatter plot. So why bother? R2 tells me something important that I understand and need to know. Leave it alone.
What about statistical significance?
I fear that “significance” is, pace George Miller, “a word worn smooth by many tongues”. It is a word that I try to avoid. Yet it seems a natural practice for some people to calculate a p-value and ask whether the regression is significant.
I have criticised p-values elsewhere. I might calculate them sometimes but only because I know what I am doing. The terrible fact is that if you collect sufficient data then your regression will eventually be significant. Statistical significance only tells me that you collected a lot of data. That’s why so many studies published in the press are misleading. Collect enough data and you will get a “significant” result. It doesn’t mean it matters in the real world.
R2 is the real world measure of sensible trouble (relatively) impervious to statistical manipulation. I can make p as small as I like just by collecting more and more data. In fact there is an equation that, for any given R2, links p and the number of observations, n, for linear regression.8
![]()
Here, Fμ, ν(x) is the F-distribution with μ and ν degrees of freedom. A little playing about with that equation in Excel will reveal that you can make p as small as you like without R2 changing at all. Simply by making n larger. Collecting data until p is small is mere p-hacking. All p-values should be avoided by the novice. R2 is the real world measure (relatively) impervious to statistical manipulation. That is what I am interested in. And what your boss should be interested in.
Next time
Once we are confident that our regression model is stable and predictable, and that the regression is worth having, we can move on to the next stage.
Next time I shall look at prediction intervals and how to assess uncertainty in forecasts.
References
- Kahneman, D (2011) Thinking, Fast and Slow, Allen Lane, p240
- Berkeley, G (1710) A Treatise Concerning the Principles of Human Knowledge, Part 1, Dublin
- Stigler, S M (2016) The Seven Pillars of Statistical Wisdom, Harvard University Press, pp141-148
- Taguchi, G (1987) The System of Experimental Design: Engineering Methods to Optimize Quality and Minimize Costs, Quality Resources
- Draper, N R & Smith, H (1998) Applied Regression Analysis, 3rd ed., Wiley, p30
- Draper & Smith (1998) p33
- For an appealing discussion of cause-systems from a broader cultural standpoint see: Bostridge, I (2015) Schubert’s Winter Journey: Anatomy of an Obsession, Faber, pp358-365
- Draper & Smith (1998) p243

I endorse the points made in this blog, a simple but important way of viewing the value of relationships. I can’t help though adding a point that seems to be very widely ignored. The basic, widely used formulae for regression assumes that the ‘X’ is known without uncertainty. In my experience, many if not most ‘Xs’ have uncertainty associated with the individual ‘X’ values. This impacts both the estimate of the predicting relationship (the slope in simple regression) and the value of R squared (the amount of the Y variation explained). Crudely R squared will be lower for an equivalent ‘value’ relationship. This should encourage those of us seriously trying to understand casuations to investigate relationships that have quite low R squares.