
I recently blogged about statistics of suicides on British railways here and here. Some very worthwhile programmes had been put in place with the objective of reducing these tragic deaths. However, my view at the point of my earlier posts was that this was a stable system of trouble, that there was neither a deteriorating trend nor any sign of improvement.
I now have the statistics for 2012/2013 to hand, released without any framing press notice. Here is the updated process behaviour chart.
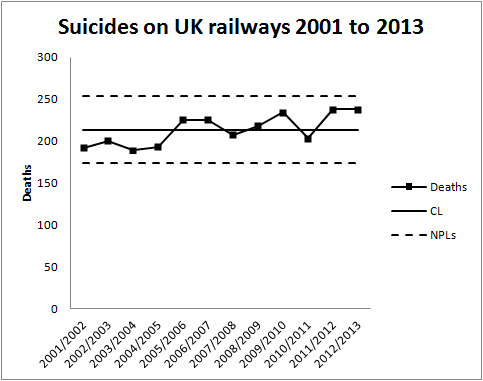
Readers should note the following about the chart.
- Some of the numbers for earlier years have been updated by the statistical authority.
- I have recalculated natural process limits as there are still no more than 20 annual observations.
- There is still no signal of improvement or deterioration.
I fear that this is the tough discipline of the chart. It confronts us with current reality and deprives us of the opportunity to find comforting messages. Only a signal on the chart would be evidence of improvement. Statistics are not there to be selectively reported only when they fit our wishes and hopes. Statistics are to be charted, and reported, and discussed, and used as a basis for managing any operation; year in, year out.
Remember that in leading any operation the manager is confined to the retreating picture in the rearview mirror. Without the process behaviour chart, the manager is deprived even of that rear view.
It is a sad picture but improvement only comes from confronting current failure and finding new ways to intervene and redesign. Nobody will benefit from an ultimately vain quest for comforting messages.
