Deconstructing Deming XI B – Eliminate numerical goals for management

11. Part B. Eliminate numerical goals for management.

W. Edwards Deming.jpgA supposed corollary to the elimination of numerical quotas for the workforce.

This topic seems to form a very large part of what passes for exploration and development of Deming’s ideas in the present day. It gets tied in to criticisms of remuneration practices and annual appraisal, and target-setting in general (management by objectives). It seems to me that interest flows principally from a community who have some passionately held emotional attitudes to these issues. Advocates are enthusiastic to advance the views of theorists like Alfie Kohn who deny, in terms, the effectiveness of traditional incentives. It is sad that those attitudes stifle analytical debate. I fear that the problem started with Deming himself.

Deming’s detailed arguments are set out in Out of the Crisis (at pp75-76). There are two principle reasoned objections.

  1. Managers will seek empty justification from the most convenient executive time series to hand.
  2. Surely, if we can improve now, we would have done so previously, so managers will fall back on (1).

The executive time series

I’ve used the time series below in some other blogs (here in 2013 and here in 2012). It represents the anual number of suicides on UK railways. This is just the data up to 2013.
RailwaySuicides2

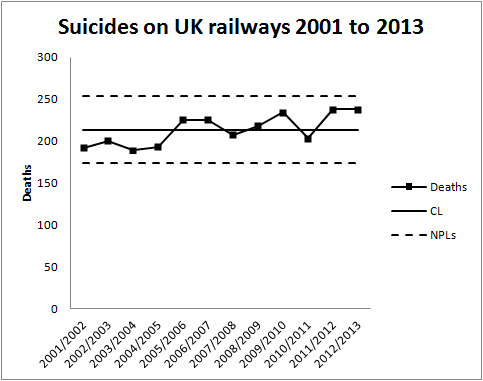
The process behaviour chart shows a stable system of trouble. There is variation from year to year but no significant (sic) pattern. There is noise but no signal. There is an average of just over 200 fatalities, varying irregularly between around 175 and 250. Sadly, as I have discussed in earlier blogs, simply selecting a pair of observations enables a polemicist to advance any theory they choose.

In Railway Suicides in the UK: risk factors and prevention strategies, Kamaldeep Bhui and Jason Chalangary of the Wolfson Institute of Preventive Medicine, and Edgar Jones of the Institute of Psychiatry, King’s College, London quoted the Rail Safety and Standards Board (RSSB) in the following two assertions.

  • Suicides rose from 192 in 2001-02 to a peak 233 in 2009-10; and
  • The total fell from 233 to 208 in 2010-11 because of actions taken.

Each of these points is what Don Wheeler calls an executive time series. Selective attention, or inattention, on just two numbers from a sequence of irregular variation can be used to justify any theory. Deming feared such behaviour could be perverted to justify satisfaction of any goal. Of course, the process behaviour chart, nowhere more strongly advocated than by Deming himself in Out of the Crisis, is the robust defence against such deceptions. Diligent criticism of historical data by means of process behaviour charts is exactly what is needed to improve the business and exactly what guards against success-oriented interpretations.

Wishful thinking, and the more subtle cognitive biases studied by Daniel Kahneman and others, will always assist us in finding support for our position somewhere in the data. Process behaviour charts keep us objective.

If not now, when?

If I am not for myself, then who will be for me?
And when I am for myself, then what am “I”?
And if not now, when?

Hillel the Elder

Deming criticises managerial targets on the grounds that, were the means of achieving the target known, it would already have been achieved and, further, that without having the means efforts are futile at best. It’s important to remember that Deming is not here, I think, talking about efforts to stabilise a business process. Deming is talking about working to improve an already stable, but incapable, process.

There are trite reasons why a target might legitimately be mandated where it has not been historically realised. External market conditions change. A manager might unremarkably be instructed to “Make 20% more of product X and 40% less of product Y“. That plays in to the broader picture of targets’ role in co-ordinating the parts of a system, internal to the organisation of more widely. It may be a straightforward matter to change the output of a well-understood, stable system by an adjustment of the inputs.

Deming says:

If you have a stable system, then there is no use to specify a goal. You will get whatever the system will deliver.

But it is the manager’s job to work on a stable system to improve its capability (Out of the Crisis at pp321-322). That requires capital and a plan. It involves a target because the target captures the consensus of the whole system as to what is required, how much to spend, what the new system looks like to its customer. Simply settling for the existing process, being managed through systematic productivity to do its best, is exactly what Deming criticises at his Point 1 (Constancy of purpose for improvement).

Numerical goals are essential

… a manager is an information channel of decidedly limited capacity.

Kenneth Arrow
Essays in the Theory of Risk-Bearing

Deming’s followers have, to some extent, conceded those criticisms. They say that it is only arbitrary targets that are deprecated and not the legitimate Voice of the Customer/ Voice of the Business. But I think they make a distinction without a difference through the weasel words “arbitrary” and “legitimate”. Deming himself was content to allow managerial targets relating to two categories of existential risk.

However, those two examples are not of any qualitatively different type from the “Increase sales by 10%” that he condemns. Certainly back when Deming was writing Out of the Crisis most OELs were based on LD50 studies, a methodology that I am sure Deming would have been the first to criticise.

Properly defined targets are essential to business survival as they are one of the principal means by which the integrated function of the whole system is communicated. If my factory is producing more than I can sell, I will not work on increasing capacity until somebody promises me that there is a plan to improve sales. And I need to know the target of the sales plan to know where to aim with plant capacity. It is no good just to say “Make as much as you can. Sell as much as you can.” That is to guarantee discoordination and inefficiency. It is unsurprising that Deming’s thinking has found so little real world implementation when he seeks to deprive managers of one of the principle tools of managing.

Targets are dangerous

I have previously blogged about what is needed to implement effective targets. An ill judged target can induce perverse incentives. These can be catastrophic for an organisation, particularly one where the rigorous criticism of historical data is absent.

Data and anecdote revisited – the case of the lime jellybean

JellyBellyBeans.jpgI have already blogged about the question of whether data is the plural of anecdote. Then I recently came across the following problem in the late Richard Jeffrey’s marvellous little book Subjective Probability: The Real Thing (2004, Cambridge) and it struck me as a useful template for thinking about data and anecdotes.

The problem looks like a staple of elementary statistics practice exercises.

You are drawing a jellybean from a bag in which you know half the beans are green, all the lime flavoured ones are green and the green ones are equally divided between lime and mint flavours.

You draw a green bean. Before you taste it, what is the probability that it is lime flavoured?

A mathematically neat answer would be 50%. But what if, asked Jeffrey, when you drew the green bean you caught a whiff of mint? Or the bean was a particular shade of green that you had come to associate with “mint”. Would your probability still be 50%?

The given proportions of beans in the bag are our data. The whiff of mint or subtle colouration is the anecdote.

What use is the anecdote?

It would certainly be open to a participant in the bean problem to maintain the 50% probability derived from the data and ignore the inferential power of the anecdote. However, the anecdote is evidence that we have and, if we choose to ignore it simply because it is difficult to deal with, then we base our assessment of risk on a more restricted picture than that actually available to us.

The difficulty with the anecdote is that it does not lead to any compelling inference in the same way as do the mathematical proportions. It is easy to see how the bean proportions would give rise to a quite extensive consensus about the probability of “lime”. There would be more variety in individual responses to the anecdote, in what weight to give the evidence and in what it tended to imply.

That illustrates the tension between data and anecdote. Data tends to consensus. If there is disagreement as to its weight and relevance then the community is likely to divide into camps rather than exhibit a spectrum of views. Anecdote does not lead to such a consensus. Individuals interpret anecdotes in diverse ways and invest them with varying degrees of credence.

Yet, the person who is best at weighing and interpreting the anecdotal evidence has the advantage over the broad community who are in agreement about what the proportion data tells them. It will often be the discipline specialist who is in the best position to interpret an anecdote.

From anecdote to data

One of the things that the “mint” anecdote might do is encourage us to start collecting future data on what we smelled when a bean was drawn. A sequence of such observations, along with the actual “lime/ mint” outcome, potentially provides a potent decision support mechanism for future draws. At this point the anecdote has been developed into data.

This may be a difficult process. The whiff of mint or subtle colouration could be difficult to articulate but recognising its significance (sic) is the beginning of operationalising and sharing.

Statistician John Tukey advocated the practice of exploratory data analysis (EDA) to identify such anecdotal evidence before settling on a premature model. As he observed:

The greatest value of a picture is when it forces us to notice what we never expected to see.

Of course, the person who was able to use the single anecdote on its own has the advantage over those who had to wait until they had compelling data. Data that they share with everybody else who has the same idea.

Data or anecdote

When I previously blogged about this I had trouble in coming to any definition that distinguished data and anecdote. Having reflected, I have a modest proposal. Data is the output of some reasonably well-defined process. Anecdote isn’t. It’s not clear how it was generated.

We are not told by what process the proportion of beans was established but I am willing to wager that it was some form of counting.

If we know the process generating evidence then we can examine its biases, non-responses, precision, stability, repeatability and reproducibility. Anecdote we cannot. It is because we can characterise the measurement process, through measurement systems analysis, that we can assess its reliability and make appropriate allowances and adjustments for its limitations. An assessment that most people will agree with most of the time. Because the most potent tools for assessing the reliability of evidence are absent in the case of anecdote, there are inherent difficulties in its interpretation and there will be a spectrum of attitudes from the community.

However, having had our interest pricked by the anecdote, we can set up a process to generate data.

Borrowing strength again

Using an anecdote as the basis for further data generation is one approach to turning anecdote into reliable knowledge. There is another way.

Today in the UK, a jury of 12 found nurse Victorino Chua, beyond reasonable doubt, guilty of poisoning 21 of his patients with insulin. Two died. There was no single compelling piece of evidence put before the jury. It was all largely circumstantial. The prosecution had sought to persuade the jury that those various items of circumstantial evidence reinforced each other and led to a compelling inference.

This is a common situation in litigation where there is no single conclusive piece of data but various pieces of circumstantial evidence that have to be put together. Where these reinforce, they inherit borrowing strength from each other.

Anecdotal evidence is not really the sort of evidence we want to have. But those who know how to use it are way ahead of those embarrassed by it.

Data is the plural of anecdote, either through repetition or through borrowing.

The art of managing footballers

Van Persie (15300483040) (crop).jpg… or is it a science? Robin van Persie’s penalty miss against West Bromwich Albion on 2 May 2015 was certainly welcome news to my ears. It eased the relegation pressures on West Brom and allowed us to advance to 40 points for the season. Relegation fears are only “mathematical” now. However, the miss also resulted in van Persie being relieved of penalty taking duties, by Manchester United manager Louis van Gaal, until further notice.

He is now at the end of the road. It is always [like that]. Wayne [Rooney] has missed also so when you miss you are at the bottom again.

The Daily Mail report linked above goes on to say that van Persie had converted his previous 6 penalties.

Van Gaal was, of course, referring to Rooney’s shot over the crossbar against West Ham in February 2013, when Rooney had himself invited then manager Sir Alex Ferguson to retire him as designated penalty taker. Rooney’s record had apparently been 9 misses from 27 penalties. I have all this from this Daily Telegraph report.

I wonder if statistics can offer any insight into soccer management?

The benchmark

It was very difficult to find, very quickly, any exhaustive statistics on penalty conversion rates on the web. However, I would like to start by establishing what constituted “good” performance for a penalty taker. As a starting point I have looked at Table 2 on this Premier League website. The data is from February 2014 and shows, at that date, data on the players with the best conversion rates in the League’s history. Players who took fewer than 10 penalties were excluded. It shows that of the ten top converting players, who must rank as the very good if not the ten best, in the aggregate they converted 155 of 166 penalties. That is a conversion rate of 93.4%. At first sight that suggests a useful baseline against which to assess any individual penalty taker.

Several questions come to mind. The aggregate statistics do not tell us how individual players have developed over time, whether improving or losing their nerve. That said, it is difficult to perform that sort of analysis on these comparatively low volumes of data when collected in this way. There is however data (Table 4) on the overall conversion rate in the Premier League since its inception.

Penalties

That looks to me like a fairly stable system. That would be expected as players come and go and this is the aggregate of many effects. Perhaps there is latterly reduced season-to-season variation, which would be odd, but I am not really interested in that and have not pursued it. I am aware that during this period there has been a rule change allowing goalkeepers to move before the kick his taken but I have just spent 30 minutes on the web and failed to establish the date when that happened. The total aggregate statistics up to 2014 are 1,438 penalties converted out of 1,888. That is a conversion rate of 76.2%.

I did wonder if there was any evidence that some of the top ten players were better than others or whether the data was consistent with a common elite conversion rate of 93.4%. In that case the table positions would reflect nothing more than sampling variation. Somewhat reluctantly I calculated the chi-squared statistic for the table of successes and failures (I know! But what else to do?). The statistic came out as 2.02 which, with 9 degrees of freedom, has a p-value (I know!) of 0.8%. That is very suggestive of a genuine ranking among the elite penalty takers.

It inevitably follows that the elite are doing better than the overall success rate of 76.2%. Considering all that together I am happy to proceed with 93.4% as the sort of benchmark for a penalty taker that a team like Manchester United would aspire to.

Van Persie

This website, dated 6 Sept 2012, told me that van Persie had converted 18 penalties with a 77% success rate. That does not quite fit either 18/23 or 18/24 but let us take it at face value. If that is accurate then that is, more or less, the data on which Ferguson gave van Persie the job in February 2013. It is a surprising appointment given the Premier League average of 76.2% and the elite benchmark but perhaps it was the best that could be mustered from the squad.

Rooney’s 9 misses out of 27 yields a success rate of 67%. Not so much lower than van Persie’s historical performance but, in all the circumstances, it was not good enough.

The dismissal

What is fascinating is that, no matter what van Persie’s historical record on which he was appointed penalty taker, before his 2 May miss he had scored 6 out of 6. The miss made it 6 out of 7, 85.7%. That was his recent record of performance, even if selected to some extent to show him in a good light.

Selection of that run is a danger. It is often “convenient” to select a subset of data that favours a cherished hypothesis. Though there might be that selectivity, where was the real signal that van Persie had deteriorated or that the club would perform better were he replaced?

The process

Of course, a manager has more information than the straightforward success/ fail ratio. A coach may have observed goalkeepers increasingly guessing a penalty taker’s shot direction. There may have been many near-saves, a hesitancy on the part of the player, trepidation in training. Those are all factors that a manager must take into account. That may lead to the rotation of even the most impressive performer. Perhaps.

But that is not the process that van Gaal advocates. Keep scoring until you miss then go to the bottom of the list. The bottom! Even scorers in the elite-10 miss sometimes. Is it rational to then replace them with an alternative that will most likely be more average (i.e. worse)? And then make them wait until everyone else has missed.

With an average success rate of 76.2% it is more likely than not that van Persie’s replacement will score their first penalty. Van Gaal will be vindicated. That is the phenomenon called regression to the mean. An extreme event (a miss) is most likely followed by something more average (a goal). Economist Daniel Kahneman explores this at length in his book Thinking, Fast and Slow.

It is an odd strategy to adopt. Keep the able until they fail. Then replace them with somebody less able. But different.


Royal babies and the wisdom of crowds

Prince George of Cambridge with wombat plush toy (crop).jpgIn 2004 James Surowiecki published a book with the unequivocal title The Wisdom of Crowds: Why the Many Are Smarter Than the Few and How Collective Wisdom Shapes Business, Economies, Societies and Nations. It was intended as a gloss on Charles Mackay’s 1841 book Extraordinary Popular Delusions and the Madness of Crowds. Both books are essential reading for any risk professional.

I am something of a believer in the wisdom of crowds. The other week I was fretting about the possible relegation of English Premier League soccer club West Bromwich Albion. It’s an emotional and atavistic tie for me. I always feel there is merit, as part of my overall assessment of risk, in checking online bookmakers’ odds. They surely represent the aggregated risk assessment of gamblers if nobody else. I was relieved that bookmakers were offering typically 100/1 against West Brom being relegated. My own assessment of risk is, of course, contaminated with personal anxiety so I was pleased that the crowd was more phlegmatic.

However, while I was on the online bookmaker’s website, I couldn’t help but notice that they were also accepting bets on the imminent birth of the royal baby, the next child of the Duke and Duchess of Cambridge. It struck me as weird that anyone would bet on the sex of the royal baby. Surely this was a mere coin toss, though I know that people will bet on that. Being hopelessly inquisitive I had a look. I was somewhat astonished to find these odds being offered (this was 22 April 2015, ten days before the royal birth).

odds implied probability
Girl 1/2 0.67
Boy 6/4 0.40
 Total 1.07

Here I have used the usual formula for converting between odds and implied probabilities: odds of m / n against an event imply a probability of n / (m + n) of the event occurring. Of course, the principle of finite additivity requires that probabilities add up to one. Here they don’t and there is an overround of 7%. Like the rest of us, bookmakers have to make a living and I was unsurprised to find a Dutch book.

The odds certainly suggested that the crowd thought a girl manifestly more probable than a boy. Bookmakers shorten the odds on the outcome that is attracting the money to avoid a heavy payout on an event that the crowd seems to know something about.

Historical data on sex ratio

I started, at this stage, to doubt my assumption that boy/ girl represented no more than a coin toss, 50:50, an evens bet. As with most things, sex ratio turns out to be an interesting subject. I found this interesting research paper which showed that sex ratio was definitely dependent on factors such as the age and ethnicity of the mother. The narrative of this chart was very interesting.

Sex ratio

However, the paper confirmed that the sex of a baby is independent of previous births, conditioned on the factors identified, and that the ratio of girls to boys is nowhere and no time greater than 1,100 to 1000, about 52% girls.

So why the odds?

Bookmakers lengthen the odds on the outcome attracting the smaller value of bets in order to encourage stakes on the less fancied outcomes, on which there is presumably less risk of having to pay out. At odds of 6/4, a punter betting £10 on a boy would receive his stake back plus £15 ( = 6 × £10 / 4 ). If we assume an equal chance of boy or girl then that is an expected return of £12.50 ( = 0.5 × £25 ) for a £10.00 stake. I’m not sure I’d seen such a good value wager since we all used to bet against Tim Henman winning Wimbledon.

Ex ante there are two superficially suggestive explanations as to the asymmetry in the odds. At least this is all my bounded rationality could imagine.

  • A lot of people (mistakenly) thought that the run of five male royal births (Princes Andrew, Edward, William, Harry and George) escalated the probability of a girl being next. “It was overdue.”
  • A lot of people believed that somebody “knew something” and that they knew what it was.

In his book about cognitive biases in decision making (Thinking, Fast and Slow, Allen Lane, 2011) Nobel laureate economist Daniel Kahneman describes widespread misconceptions concerning randomness of boy/ girl birth outcomes (at p115). People tend to see regularity in sequences of data as evidence of non-randomness, even where patterns are typical of, and unsurprising in, random events.

I had thought that there could not be sufficient gamblers who would be fooled by the baseless belief that a long run of boys made the next birth more likely to be a girl. But then Danny Finkelstein reminded me (The (London) Times, Saturday 25 April 2015) of a survey of UK politicians that revealed their limited ability to deal with chance and probabilities. Are politicians more or less competent with probabilities than online gamblers? That is a question for another day. I could add that the survey compared politicians of various parties but we have an on-going election campaign in the UK at the moment so I would, in the interest of balance, invite my voting-age UK readers not to draw any inferences therefrom.

The alternative is the possibility that somebody thought that somebody knew something. The parents avowed that they didn’t know. Medical staff may or may not have. The sort of people who work in VIP medicine in the UK are not the sort of people who divulge information. But one can imagine that a random shift in sentiment, perhaps because of the misconception that a girl was “overdue”, and a consequent drift in the odds, could lead others to infer that there was insight out there. It is not completely impossible. How many other situations in life and business does that model?

It’s a girl!

The wisdom of crowds or pure luck? We shall never know. I think it was Thomas Mann who observed that the best proof of the genuineness of a prophesy was that it turned out to be false. Had the royal baby been a boy we could have been sure that the crowd was mad.

To be complete, Bayes’ theorem tells us that the outcome should enhance our degree of belief in the crowd’s wisdom. But it is a modest increase (Bayes’ factor of 2, 3 deciban after Alan Turing’s suggestion) and as we were most sceptical before we remain unpersuaded.

In his book, Surowiecki identified five factors that can impair crowd intelligence. One of these is homogeneity. Insufficient diversity frustrates the inherent virtue on which the principle is founded. I wonder how much variety there is among online punters? Similarly, where judgments are made sequentially there is a danger of influence. That was surely a factor at work here. There must also have been an element of emotion, the factor that led to all those unrealistically short odds on Henman at Wimbledon on which the wise dined so well.

But I’m trusting that none of that applies to the West Brom odds.