Anecdotes and p-values

JellyBellyBeans.jpgI have been feeling guilty ever since I recently published a p-value. It led me to sit down and think hard about why I could not resist doing so and what I really think it told me, if anything. I suppose that a collateral question is to ask why I didn’t keep it to myself. To be honest, I quite often calculate p-values though I seldom let on.

It occurred to me that there was something in common between p-values and the anecdotes that I have blogged about here and here. Hence more jellybeans.

What is a p-value?

My starting data was the conversion rates of 10 elite soccer penalty takers. Each of their conversion rates was different. Leighton Baines had the best figures having converted 11 out of 11. Peter Beardsley and Emmanuel Adebayor had the superficially weakest, having converted 18 out of 20 and 9 out of 10 respectively. To an analyst that raises a natural question. Was the variation between the performance signal or was it noise?

In his rather discursive book The Signal and the Noise: The Art and Science of Prediction, Nate Silver observes:

The signal is the truth. The noise is what distracts us from the truth.

In the penalties data the signal, the truth, that we are looking for is Who is the best penalty taker and how good are they? The noise is the sampling variation inherent in a short sequence of penalty kicks. Take a coin and toss it 10 times. Count the number of heads. Make another 10 tosses. And a third 10. It is unlikely that you got the same number of heads but that was not because anything changed in the coin. The variation between the three counts is all down to the short sequence of tosses, the sampling variation.

In Understanding Variation: The Key to Managing ChaosDon Wheeler observes:

All data has noise. Some data has signal.

We first want to know whether the penalty statistics display nothing more than sampling variation or whether there is also a signal that some penalty takers are better than others, some extra variation arising from that cause.

The p-value told me the probability that we could have observed the data we did had the variation been solely down to noise, 0.8%. Unlikely.

p-Values do not answer the exam question

The first problem is that p-values do not give me anything near what I really want. I want to know, given the observed data, what it the probability that penalty conversion rates are just noise. The p-value tells me the probability that, were penalty conversion rates just noise, I would have observed the data I did.

The distinction is between the probability of data given a theory and the probability of a theory give then data. It is usually the latter that is interesting. Now this may seem like a fine distinction without a difference. However, consider the probability that somebody with measles has spots. It is, I think, pretty close to one. Now consider the probability that somebody with spots has measles. Many things other than measles cause spots so that probability is going to be very much less than one. I would need a lot of information to come to an exact assessment.

In general, Bayes’ theorem governs the relationship between the two probabilities. However, practical use requires more information than I have or am likely to get. The p-values consider all the possible data that you might have got if the theory were true. It seems more rational to consider all the different theories that the actual data might support or imply. However, that is not so simple.

A dumb question

In any event, I know the answer to the question of whether some penalty takers are better than others. Of course they are. In that sense p-values fail to answer a question to which I already know the answer. Further, collecting more and more data increases the power of the procedure (the probability that it dodges a false negative). Thus, by doing no more than collecting enough data I can make the p-value as small as I like. A small p-value may have more to do with the number of observations than it has with anything interesting in penalty kicks.

That said, what I was trying to do in the blog was to set a benchmark for elite penalty taking. As such this was an enumerative study. Of course, had I been trying to select a penalty taker for my team, that would have been an analytic study and I would have to have worried additionally about stability.

Problems, problems

There is a further question about whether the data variation arose from happenstance such as one or more players having had the advantage of weather or ineffective goalkeepers. This is an observational study not a designed experiment.

And even if I observe a signal, the p-value does not tell me how big it is. And it doesn’t tell me who is the best or worst penalty taker. As R A Fisher observed, just because we know there had been a murder we do not necessarily know who was the murderer.

E pur si muove

It seems then that individuals will have different ways of interpreting p-values. They do reveal something about the data but it is not easy to say what it is. It is suggestive of a signal but no more. There will be very many cases where there are better alternative analytics about which there is less ambiguity, for example Bayes factors.

However, in the limited case of what I might call alternative-free model criticism I think that the p-value does provide me with some insight. Just to ask the question of whether the data is consistent with the simplest of models. However, it is a similar insight to that of an anecdote: of vague weight with little hope of forming a consensus round its interpretation. I will continue to calculate them but I think it better if I keep quiet about it.

R A Fisher often comes in for censure as having done more than anyone to advance the cult of p-values. I think that is unfair. Fisher only saw p-values as part of the evidence that a researcher would have to hand in reaching a decision. He saw the intelligent use of p-values and significance tests as very different from the, as he saw it, mechanistic practices of hypothesis testing and acceptance procedures on the Neyman-Pearson model.

In an acceptance procedure, on the other hand, acceptance is irreversible, whether the evidence for it was strong or weak. It is the result of applying mechanically rules laid down in advance; no thought is given to the particular case, and the tester’s state of mind, or his capacity for learning is inoperative. By contrast, the conclusions drawn by a scientific worker from a test of significance are provisional, and involve an intelligent attempt to understand the experimental situation.

“Statistical methods and scientific induction”
Journal of the Royal Statistical Society Series B 17: 69–78. 1955, at 74-75

Fisher was well known for his robust, sometimes spiteful, views on other people’s work. However, it was Maurice Kendall in his obituary of Fisher who observed that:

… a man’s attitude toward inference, like his attitude towards religion, is determined by his emotional make-up, not by reason or mathematics.

Royal babies and the wisdom of crowds

Prince George of Cambridge with wombat plush toy (crop).jpgIn 2004 James Surowiecki published a book with the unequivocal title The Wisdom of Crowds: Why the Many Are Smarter Than the Few and How Collective Wisdom Shapes Business, Economies, Societies and Nations. It was intended as a gloss on Charles Mackay’s 1841 book Extraordinary Popular Delusions and the Madness of Crowds. Both books are essential reading for any risk professional.

I am something of a believer in the wisdom of crowds. The other week I was fretting about the possible relegation of English Premier League soccer club West Bromwich Albion. It’s an emotional and atavistic tie for me. I always feel there is merit, as part of my overall assessment of risk, in checking online bookmakers’ odds. They surely represent the aggregated risk assessment of gamblers if nobody else. I was relieved that bookmakers were offering typically 100/1 against West Brom being relegated. My own assessment of risk is, of course, contaminated with personal anxiety so I was pleased that the crowd was more phlegmatic.

However, while I was on the online bookmaker’s website, I couldn’t help but notice that they were also accepting bets on the imminent birth of the royal baby, the next child of the Duke and Duchess of Cambridge. It struck me as weird that anyone would bet on the sex of the royal baby. Surely this was a mere coin toss, though I know that people will bet on that. Being hopelessly inquisitive I had a look. I was somewhat astonished to find these odds being offered (this was 22 April 2015, ten days before the royal birth).

odds implied probability
Girl 1/2 0.67
Boy 6/4 0.40
 Total 1.07

Here I have used the usual formula for converting between odds and implied probabilities: odds of m / n against an event imply a probability of n / (m + n) of the event occurring. Of course, the principle of finite additivity requires that probabilities add up to one. Here they don’t and there is an overround of 7%. Like the rest of us, bookmakers have to make a living and I was unsurprised to find a Dutch book.

The odds certainly suggested that the crowd thought a girl manifestly more probable than a boy. Bookmakers shorten the odds on the outcome that is attracting the money to avoid a heavy payout on an event that the crowd seems to know something about.

Historical data on sex ratio

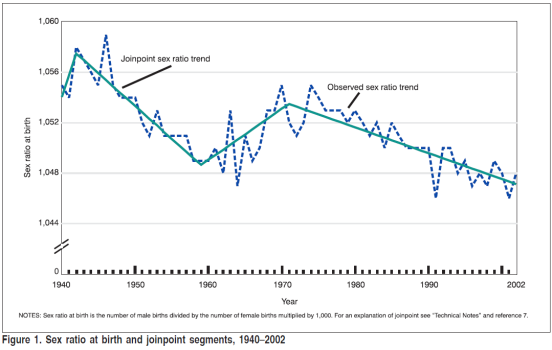
I started, at this stage, to doubt my assumption that boy/ girl represented no more than a coin toss, 50:50, an evens bet. As with most things, sex ratio turns out to be an interesting subject. I found this interesting research paper which showed that sex ratio was definitely dependent on factors such as the age and ethnicity of the mother. The narrative of this chart was very interesting.

Sex ratio

However, the paper confirmed that the sex of a baby is independent of previous births, conditioned on the factors identified, and that the ratio of girls to boys is nowhere and no time greater than 1,100 to 1000, about 52% girls.

So why the odds?

Bookmakers lengthen the odds on the outcome attracting the smaller value of bets in order to encourage stakes on the less fancied outcomes, on which there is presumably less risk of having to pay out. At odds of 6/4, a punter betting £10 on a boy would receive his stake back plus £15 ( = 6 × £10 / 4 ). If we assume an equal chance of boy or girl then that is an expected return of £12.50 ( = 0.5 × £25 ) for a £10.00 stake. I’m not sure I’d seen such a good value wager since we all used to bet against Tim Henman winning Wimbledon.

Ex ante there are two superficially suggestive explanations as to the asymmetry in the odds. At least this is all my bounded rationality could imagine.

  • A lot of people (mistakenly) thought that the run of five male royal births (Princes Andrew, Edward, William, Harry and George) escalated the probability of a girl being next. “It was overdue.”
  • A lot of people believed that somebody “knew something” and that they knew what it was.

In his book about cognitive biases in decision making (Thinking, Fast and Slow, Allen Lane, 2011) Nobel laureate economist Daniel Kahneman describes widespread misconceptions concerning randomness of boy/ girl birth outcomes (at p115). People tend to see regularity in sequences of data as evidence of non-randomness, even where patterns are typical of, and unsurprising in, random events.

I had thought that there could not be sufficient gamblers who would be fooled by the baseless belief that a long run of boys made the next birth more likely to be a girl. But then Danny Finkelstein reminded me (The (London) Times, Saturday 25 April 2015) of a survey of UK politicians that revealed their limited ability to deal with chance and probabilities. Are politicians more or less competent with probabilities than online gamblers? That is a question for another day. I could add that the survey compared politicians of various parties but we have an on-going election campaign in the UK at the moment so I would, in the interest of balance, invite my voting-age UK readers not to draw any inferences therefrom.

The alternative is the possibility that somebody thought that somebody knew something. The parents avowed that they didn’t know. Medical staff may or may not have. The sort of people who work in VIP medicine in the UK are not the sort of people who divulge information. But one can imagine that a random shift in sentiment, perhaps because of the misconception that a girl was “overdue”, and a consequent drift in the odds, could lead others to infer that there was insight out there. It is not completely impossible. How many other situations in life and business does that model?

It’s a girl!

The wisdom of crowds or pure luck? We shall never know. I think it was Thomas Mann who observed that the best proof of the genuineness of a prophesy was that it turned out to be false. Had the royal baby been a boy we could have been sure that the crowd was mad.

To be complete, Bayes’ theorem tells us that the outcome should enhance our degree of belief in the crowd’s wisdom. But it is a modest increase (Bayes’ factor of 2, 3 deciban after Alan Turing’s suggestion) and as we were most sceptical before we remain unpersuaded.

In his book, Surowiecki identified five factors that can impair crowd intelligence. One of these is homogeneity. Insufficient diversity frustrates the inherent virtue on which the principle is founded. I wonder how much variety there is among online punters? Similarly, where judgments are made sequentially there is a danger of influence. That was surely a factor at work here. There must also have been an element of emotion, the factor that led to all those unrealistically short odds on Henman at Wimbledon on which the wise dined so well.

But I’m trusting that none of that applies to the West Brom odds.

Is data the plural of anecdote?

I seem to hear this intriguing quote everywhere these days.

The plural of anecdote is not data.

There is certainly one website that traces it back to Raymond Wolfinger, a political scientist from Berkeley, who claims to have said sometime around 1969 to 1970:

The plural of anecdote is data.

So, which is it?

Anecdote

My Concise Oxford English Dictionary (“COED”) defines “anecdote” as:

Narrative … of amusing or interesting incident.

Wiktionary gives a further alternative definition.

An account which supports an argument, but which is not supported by scientific or statistical analysis.

Edward Jenner by James Northcote.jpg

It’s clear that anecdote itself is a concept without a very exact meaning. It’s a story, not usually reported through an objective channel such as a journalism, or scientific or historical research, that carries some implication of its own unreliability. Perhaps it is inherently implausible when read against objective background evidence. Perhaps it is hearsay or multiple hearsay.

The anecdote’s suspect reliability is offset by the evidential weight it promises, either as a counter example to a cherished theory or as compelling support for a controversial hypothesis. Lyall Watson’s hundredth monkey story is an anecdote. So, in eighteenth century England, was the folk wisdom, recounted to Edward Jenner (pictured), that milkmaids were generally immune to smallpox.

Data

My COED defines “data” as:

Facts or impormation, esp[ecially] as basis for inference.

Wiktionary gives a further alternative definition.

Pieces of information.

Again, not much help. But the principal definition in the COED is:

Thing[s] known or granted, assumption or premise from which inferences may be drawn.

The suggestion in the word “data” is that what is given is the reliable starting point from which we can start making deductions or even inductive inferences. Data carries the suggestion of reliability, soundness and objectivity captured in the familiar Arthur Koestler quote.

Without the little hard bits of marble which are called “facts” or “data” one cannot compose a mosaic …

Yet it is common knowledge that “data” cannot always be trusted. Trust in data is a recurring theme in this blog. Cyril Burt’s purported data on the heritability of IQ is a famous case. There are legions of others.

Smart investigators know that the provenance, reliability and quality of data cannot be taken for granted but must be subject to appropriate scrutiny. The modern science of Measurement Systems Analysis (“MSA”) has developed to satisfy this need. The defining characteristic of anecdote is that it has been subject to no such scrutiny.

Evidence

Anecdote and data, as broadly defined above, are both forms of evidence. All evidence is surrounded by a penumbra of doubt and unreliability. Even the most exacting engineering measurement is accompanied by a recognition of its uncertainty and the limitations that places on its use and the inferences that can be drawn from it. In fact, it is exactly because such a measurement comes accompanied by a numerical characterisation of its precision and accuracy, that  its reliability and usefulness are validated.

It seems inherent in the definition of anecdote that it should not be taken at face value. Happenstance or wishful fabrication, it may not be a reliable basis for inference or, still less, action. However, it was Jenner’s attention to the smallpox story that led him to develop vaccination against smallpox. No mean outcome. Against that, the hundredth monkey storey is mere fantastical fiction.

Anecdotes about dogs sniffing out cancer stand at the beginning of the journey of confirmation and exploitation.

Two types of analysis

Part of the answer to the dilemma comes from statistician John Tukey’s observation that there are two kinds of data analysis: Exploratory Data Analysis (“EDA”) and Confirmatory Data Analysis (“CDA”).

EDA concerns the exploration of all the available data in order to suggest some interesting theories. As economist Ronald Coase put it:

If you torture the data long enough, it will confess.

Once a concrete theory or hypothesis is to mind, a rigorous process of data generation allows formal statistical techniques to be brought to bear (“CDA”) in separating the signal in the data from the noise and in testing the theory. People who muddle up EDA and CDA tend to get into difficulties. It is a foundation of statistical practice to understand the distinction and its implications.

Anecdote may be well suited to EDA. That’s how Jenner successfully proceeded though his CDA of testing his vaccine on live human subjects wouldn’t get past many ethics committees today.

However, absent that confirmatory CDA phase, the beguiling anecdote may be no more than the wrecker’s false light.

A basis for action

Tukey’s analysis is useful for the academic or the researcher in an R&D department where the environment is not dynamic and time not of the essence. Real life is more problematic. There is not always the opportunity to carry out CDA. The past does not typically repeat itself so that we can investigate outcomes with alternative factor settings. As economist Paul Samuelson observed:

We have but one sample of history.

History is the only thing that we have any data from. There is no data on the future. Tukey himself recognised the problem and coined the phrase uncomfortable science for inferences from observations whose repetition was not feasible or practical.

In his recent book Strategy: A History (Oxford University Press, 2013), Lawrence Freedman points out the risks of managing by anecdote “The Trouble with Stories” (pp615-618). As Nobel laureate psychologist Daniel Kahneman has investigated at length, our interpretation of anecdote is beset by all manner of cognitive biases such as the availability heuristic and base rate fallacy. The traps for the statistically naïve are perilous.

But it would be a fool who would ignore all evidence that could not be subjected to formal validation. With a background knowledge of statistical theory and psychological biases, it is possible to manage trenchantly. Bayes’ theorem suggests that all evidence has its value.

I think that the rather prosaic answer to the question posed at the head of this blog is that data is the plural of anecdote, as it is the singular, but anecdotes are not the best form of data. They may be all you have in the real world. It would be wise to have the sophistication to exploit them.

Deconstructing Deming III – Cease reliance on inspection

3. Cease dependence on inspection to achieve quality. Eliminate the need for massive inspection by building quality into the product in the first place.

W Edwards Deming Point 3 of Deming’s 14 Points. This at least cannot be controversial. For me it goes to the heart of Deming’s thinking.

The point is that every defective item produced (or defective service delivered) has taken cash from the pockets of customers or shareholders. They should be more angry. One day they will be. Inputs have been purchased with their cash, their resources have been deployed to transform the inputs and they will get nothing back in return. They will even face the costs of disposing of the scrap, especially if it is environmentally noxious.

That you have an efficient system for segregating non-conforming from conforming is unimpressive. That you spend even more of other people’s money reworking the product ought to be a matter of shame. Lean Six Sigma practitioners often talk of the hidden factory where the rework takes place. A factory hidden out of embarrassment. The costs remain whether you recognise them or not. Segregation is still more problematic in service industries.

The insight is not unique to Deming. This is a common theme in Lean, Six Sigma, Theory of Constraints and other approaches to operational excellence. However, Deming elucidated the profound statistical truths that belie the superficial effectiveness of inspection.

Inspection is inefficient

When I used to work in the railway industry I was once asked to look at what percentage of signalling scheme designs needed to be rechecked to defend against the danger of a logical error creeping through. The problem requires a simple application of Bayes’ theorem. I was rather taken aback at the result. There were only two strategies that made sense: recheck everything or recheck nothing. I didn’t at that point realise that this is a standard statistical result in inspection theory. For a wide class of real world situations, where the objective is to segregate non-conforming from conforming, the only sensible sampling schemes are 100% or 0%.

Where the inspection technique is destructive, such as a weld strength test, there really is only one option.

Inspection is ineffective

All inspection methods are imperfect. There will be false-positives and false-negatives. You will spend some money scrapping product you could have sold for cash. Some defective product will escape onto the market. Can you think of any examples in your own experience? Further, some of the conforming product will be only marginally conforming. It won’t delight the customer.

So build quality into the product

… and the process for producing the product (or delivering the service). Deming was a champion of the engineering philosophy of Genechi Taguchi who put forward a three-stage approach for achieving, what he called, off-line quality control.

  1. System design – in developing a product (or process) concept think about how variation in inputs and environment will affect performance. Choose concepts that are robust against sources of variation that are difficult or costly to control.
  2. Parameter design – choose product dimensions and process settings that minimise the sensitivity of performance to variation.
  3. Tolerance design – work out the residual sources of variation to which performance remains sensitive. Develop control plans for measuring, managing and continually reducing such variation.

Is there now no need to measure?

Conventional inspection aimed at approving or condemning a completed batch of output. The only thing of interest was the product and whether it conformed. Action would be taken on the batch. Deming called the application of statistics to such problems an enumerative study.

But the thing managers really need to know about is future outcomes and how they will be influenced by present decisions. There is no way of sampling the future. So sampling of the past has to go beyond mere characterisation and quantification of the outcomes. You are stuck with those and will have to take the consequences one way or another. Sampling (of the past) has to aim principally at understanding the causes of those historic outcomes. Only that enables managers to take a view on whether those causes will persist in the future, in what way they might change and how they might be adjusted. This is what Deming called an analytic study.

Essential to the ability to project data into the future is the recognition of common and special causes of variation. Only when managers are confident in thinking and speaking in those terms will their organisations have a sound basis for action. Then it becomes apparent that the results of inspection represent the occult interaction of inherent variation with threshold effects. Inspection obscures the distinction between common and special causes. It seduces the unwary into misguided action that exacerbates quality problems and reputational damage. It obscures the sad truth that, as Terry Weight put it, a disappointment is not necessarily a surprise.

The programme

  1. Drive out sensitivity to variation at the design stage.
  2. Routinely measure the inputs whose variation threatens product performance.
  3. Measure product performance too. Your bounded rationality may have led you to get (2) wrong.
  4. No need to measure every unit. We are trying to understand the cause system not segregate items.
  5. Plot data on a process behaviour chart.
  6. Stabilise the system.
  7. Establish capability.
  8. Keep on measuring to maintain stability and improve capability.

Some people think they have absorbed Deming’s thinking, mastered it even. Yet the test is the extent to which they are able to analyse problems in terms of common and special causes of variation. Is that the language that their organisation uses to communicate exceptions and business performance, and to share analytics, plans, successes and failures?

There has always been some distaste for Deming’s thinking among those who consider it cold, statistically driven and paralysed by data. But the data are only a means to getting beyond the emotional reaction to those two impostors: triumph and disaster. The language of common and special causes is a profound tool for building engagement, fostering communication and sharing understanding. Above that, it is the only sound approach to business measurement.

How to use data to promote your business

… or alternatively, five ways not to. Quite by chance, I recently came upon a paper by Neil H. Spencer and Lindsey Kevan de Lopez at the Statistical Services and Consultancy Unit of the University of Hertfordshire Business School entitled “Item-by-item sampling for promotional purposes”.

The abstract declares the aim of the paper.

In this paper we present a method for sampling items that are checked on a pass/fail basis, with a view to a claim being made about the success/failure rate for the purposes of promoting a company’s product/service.

The sort of statements the authors want to validate occur where all items outside some specification are classed as defective. I would hope that most organisations would want to protect the customer from defects like these but the authors of the paper seem to want to predicate their promotion on the defects’ escape. The statements are of the type:

There is a 95% probability that the true proportion of trains delayed by more than 5 minutes is less than 5%.

— or:

There is a 95% probability that the true proportion of widgets with diameter more than 1% from nominal is less than 5%.

I can see five reasons why you really shouldn’t try to promote your business with statements like this.

1. Telling your customers that your products are defective

Or to put it another way “Some of our products are defective. You might get one.” This might be a true statement at your current level of quality maturity but it is not something to shout at customers. All these statements do is to germinate doubt about your product in the customer’s mind. Customers want products and services that simply perform. Making customers think that they might not will be a turn off.

Customers will not think it okay to end up with a defective item or outcome. They will not put it down just to the “luck of the draw”. The products will come back but the customers won’t.

If you are lucky then your customer won’t even understand this type of promotional statement. There are just too many percentages. But they might remember the word “defect”.

2. Tolerating defects

Or to put it another way “Some of our products are defective and we don’t care.” Quoting the 5% defective with pride suggests that the producer thinks it okay to make and sell defects. In the 1980s Japanese motor manufacturers such as Toyota seized market share by producing reliable vehicles and using that as a basis for marketing and creating a reputation for quality.

Any competitive market is destined to go that way eventually. Paradoxically, what Toyota and others discovered is that the things you have to do to make things more reliable are the same things that reduce costs. Low price and high quality goods and services have an inbuilt advantage in penetrating markets.

3. Saying nothing about the product the customer is considering buying

The telling phrase is “true proportion of” trains/ widgets. As a matter of strict statistical technicality, Spencer and de Lopez don’t describe any “method for sampling” at all. They only describe a method of calculating sample size, worked out using Bayes’ theorem. Because they use the word “true”, it can only be that they were presuming what W Edwards Deming called an enumerative study, a characterisation of a particular sampling frame that yields information only about that frame. They took a particular slice of output and sampled that. Such a study is incapable of saying anything about future widgets or trains.

Put another way, “When we looked at a slice of our products we’re pretty sure that no more than 5% were defective. We don’t care. As to future products, we don’t know. Yours may be defective.”

I think we need a name for soi-disant Bayesians who chronically fail to address issues of exchangeability (stability and predictability).

4. Throwing away most of the valuable information on your product

Looking at the train example, “5% more than 5 minutes late” may mean:

  • “5% were 6 minutes late, the rest were 4 minutes late”; or
  • “4% were one hour late, 1% were cancelled and the rest were on time”; or

These various scenarios will have wholly different psychological and practical impacts on customers. Customers care which will happen to them.

Further, where we actually measure delay in minutes or diameter in millimetres, that is data that can be used to improve the business process and, with diligence, achieve the sort of excellence where quality failures and defects simply do not happen. That then provides the sort of consumer experience of satisfaction that can be developed into a public reputation for quality, performance and cost. That in turn supports promotional statements that will chime with customer aspirations and build business. Simply checking on a pass/ fail basis is an inadequate foundation for such improvement.

5. Managing by specifications

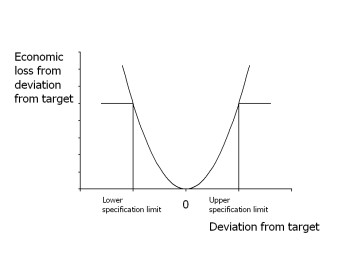
Taguchi1This is the subtlest point to turn your attention towards once everything is within specification. In the train example, the customer wants the train to be on time. Every deviation either side of that results in customer dissatisfaction. It also results in practical operating and timetable problems and costs for the railway. In the 1960s, Japanese statistician Genechi Taguchi put forward the idea that such losses should be recognised and form the basis of measuring improvement. The Taguchi loss function captures the idea that losses start with every departure from nominal and then start to escalate.

That leads to the practical insight that the improvement objective of any business process is “on target, minimum variation”.

What the Spencer-de Lopez statements ultimately say is that the vendor is willing to tolerate any train being 5 minutes late and 5% of trains being delayed even longer than that, perhaps indefinitely. Whether even that depressing standard is achieved in the future, who knows? Perhaps the customer will be lucky.

I fear that such statements will not promote your business. What will promote your business is using measurement to establish, maintain and improve process capability. That will provide the sort of excellent customer experience that can be mapped, promoted and fed back into confident, data based marketing campaigns aimed at enhancing reputation. Reputation supports talent recruitment and fosters a virtuous circle of excellence. This is what reputation management is about.

I do note that Spencer and de Lopez protest that this is only a working paper but it has been on their website since mid-2012 so I presume they are now owning the contents.

Just as a final caveat I think I should point out that the capability indices Cp and Cpk, though useful, do not measure Taguchi loss. That is the topic for another blog.