Bad Statistics I – the phantom line

I came across this chart on the web recently.

BadScatter01

This really is one of my pet hates: a perfectly informative scatter chart with a meaningless straight line drawn on it.

The scatter chart is interesting. Each individual blot represents a nation state. Its vertical position represents national average life expectancy. I take that to be mean life expectancy at birth, though it is not explained in terms. The horizontal axis represents annual per capita health spending, though there is no indication as to whether that is adjusted for purchasing power. The whole thing is a snapshot from 2011. The message I take from the chart is that Hungary and Mexico, and I think two smaller blots, represent special causes, they are outside the experience base represented by the balance of the nations. As to the other nations the chart suggests that average life expectancy doesn’t depend very strongly on health spending.

Of course, there is much more to a thorough investigation of the impact of health spending on outcomes. The chart doesn’t reveal differential performance as to morbidity, or lost hours, or a host of important economic indicators. But it does put forward that one, slightly surprising, message that longevity is not enhanced by health spending. Or at least it wasn’t in 2011 and there is no explanation as to why that year was isolated.

The question is then as to why the author decided to put the straight line through it. As the chart “helpfully” tells me it is a “Linear Trend line”. I guess (sic) that this is a linear regression through the blots, possibly with some weighting as to national population. I originally thought that the size of the blot was related to population but there doesn’t seem to be enough variation in the blot sizes. It looks like there are only two sizes of blot and the USA (population 318.5 million) is the same size as Norway (5.1 million).

The difficulty here is that I can see that the two special cause nations, Hungary and Mexico, have very high leverage. That means that they have a large impact on where the straight lines goes, because they are so unusual as observations. The impact of those two atypical countries drags the straight line down to the left and exaggerates the impact that spending appears to have on longevity. It really is an unhelpful straight line.

These lines seem to appear a lot. I think that is because of the ease with which they can be generated in Excel. They are an example of what statistician Edward Tufte called chartjunk. They simply clutter the message of the data.

Of course, the chart here is a snapshot, not a video. If you do want to know how to use scatter charts to explain life expectancy then you need to learn here from the master, Hans Rosling.

There are no lines in nature, only areas of colour, one against another.

Edouard Manet

Adoption statistics for England – signals of improvement?

I am adopted so I follow the politics of adoption fairly carefully. I was therefore interested to see this report on the BBC, claiming a “record” increase in adoptions. The quotation marks are the BBC’s. The usual meaning of such quotes is that the word “record” is not being used with its usual meaning. I note that the story was repeated in several newspapers this morning.

The UK government were claiming a 15% increase in children adopted from local authority care over the last year and the highest total since data had been collected on this basis starting in 1992.

Most people will, I think, recognise what Don Wheeler calls an executive time series. A comparison of two numbers ignoring any broader historical trends or context. Of course, any two consecutive numbers will be different. One will be greater than the other. Without the context that gives rise to the data, a comparison of two numbers is uninformative.

I decided to look at the data myself by following the BBC link to the GOV.UK website. I found a spreadsheet there but only with data from 2009 to 2013. I dug around a little more and managed to find 2006 to 2008. However, the website told me that to find any earlier data I would have to consult the National Archives. At the same time it told me that the search function at the National Archives did not work. I ended up browsing 30 web pages of Department of Education documents and managed to get figures back to 2004. However, when I tried to browse back beyond documents dated January 2008, I got “Sorry, the page you were looking for can’t be found” and an invitation to use the search facility. Needless to say, I failed to find the missing data back to 1992, there or on the Office for National Statistics website. It could just be my internet search skills that are wanting but I spent an hour or so on this.

Gladly, Justin Ushie and Julie Glenndenning from the Department for Education were able to help me and provided much of the missing data. Many thanks to them both. Unfortunately, even they could not find the data for 1992 and 1993.

Here is the run chart.

Adoption1

Some caution is needed in interpreting this chart because there is clearly some substantial serial correlation in the annual data. That said, I am not able to quite persuade myself that the 2013 figure represents a signal. Things look much better than the mid-1990s but 2013 still looks consistent with a system that has been stable since the early years of the century.

The mid 1990s is a long time ago so I also wanted to look at adoptions as a percentage of children in care. I don’t think that that is automatically a better measure but I wanted to check that it didn’t yield a different picture.

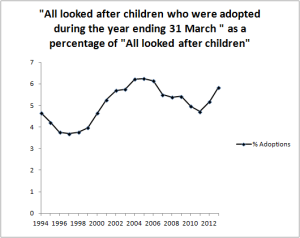
Adoption2

That confirms the improvement since the mid-1990s but the 2013 figures now look even less remarkable against the experience base of the rest of the 21st century.

I would like to see these charts with all the interventions and policy changes of respective governments marked. That would then properly set the data in context and assist interpretation. There would be an opportunity to build a narrative, add natural process limits and come to a firmer view about whether there was a signal. Sadly, I have not found an easy way of building a chronology of intervention from government publications.

Anyone holding themselves out as having made an improvement must bring forward the whole of the relevant context for the data. That means plotting data over time and flagging background events. It is only then that the decision maker, or citizen, can make a proper assessment of whether there has been an improvement. The simple chart of data against time, even without natural process limits, is immensely richer than a comparison of two selected numbers.

Properly capturing context is the essence of data visualization and the beginnings of graphical excellence.

One my favourite slogans:

In God we trust. All else bring data.

W Edwards Deming

I plan to come back to this data in 2014.

The graph of doom – one year on

I recently came across the chart (sic) below on this web site.

GraphofDoom

It’s apparently called the “graph of doom”. It first came to public attention in May 2012 in the UK newspaper The Guardian. It purports to show how the London Borough of Barnet’s spending on social services will overtake the Borough’s total budget some time around 2022.

At first sight the chart doesn’t offend too much against the principles of graphical excellence as set down by Edward Tufte in his book The Visual Display of Quantitative Information. The bars could probably have been better replaced by lines and that would have saved some expensive, coloured non-data ink. That is a small quibble.

The most puzzling thing about the chart is that it shows very little data. I presume that the figures for 2010/11 are actuals. The 2011/12 may be provisional. But the rest of the area of the chart shows predictions. There is a lot of ink on this chart showing predictions and very little showing actual data. Further, the chart does not distinguish, graphically, between actual data and predictions. I worry that that might lend the dramatic picture more authority that it is really entitled to. The visible trend lies wholly in the predictions.

Some past history would have exposed variation in both funding and spending and enabled the viewer to set the predictions in that historical context. A chart showing a converging trend of historical data projected into the future is more impressive than a chart showing historical stability with all the convergence found in the future prediction. This chart does not tell us which is the actual picture.

Further, I suspect that this is not the first time the author had made a prediction of future funds or demand. What would interest me, were I in the position of decision maker, is some history of how those predictions have performed in the past.

We are now more than one year on from the original chart and I trust that the 2012/13 data is now available. Perhaps the authors have produced an updated chart but it has not made its way onto the internet.

The chart shows hardly any historical data. Such data would have been useful to a decision maker. The ink devoted to predictions could have been saved. All that was really needed was to say that spending was projected to exceed total income around 2022. Some attempt at quantifying the uncertainty in that prediction would also have been useful.

Graphical representations of data carry a potent authority. Unfortunately, when on the receiving end of most Powerpoint presentations we don’t have long to deconstruct them. We invest a lot of trust in the author of a chart that it can be taken at face value. That ought to be the chart’s function, to communicate the information in the data efficiently and as dramatically as the data and its context justifies.

I think that the following principles can usefully apply to the charting of predictions and forecasts.

  • Use ink on data rather than speculation.
  • Ditto for chart space.
  • Chart predictions using a distinctive colour or symbol so as to be less prominent than measured data.
  • Use historical data to set predictions in context.
  • Update chart as soon as predictions become data.
  • Ensure everybody who got the original chart gets the updated chart.
  • Leave the prediction on the updated chart.

The last point is what really sets predictions in context.

Note: I have tagged this post “Data visualization”, adopting the US spelling which I feel has become standard English.