Royal babies and the wisdom of crowds

Prince George of Cambridge with wombat plush toy (crop).jpgIn 2004 James Surowiecki published a book with the unequivocal title The Wisdom of Crowds: Why the Many Are Smarter Than the Few and How Collective Wisdom Shapes Business, Economies, Societies and Nations. It was intended as a gloss on Charles Mackay’s 1841 book Extraordinary Popular Delusions and the Madness of Crowds. Both books are essential reading for any risk professional.

I am something of a believer in the wisdom of crowds. The other week I was fretting about the possible relegation of English Premier League soccer club West Bromwich Albion. It’s an emotional and atavistic tie for me. I always feel there is merit, as part of my overall assessment of risk, in checking online bookmakers’ odds. They surely represent the aggregated risk assessment of gamblers if nobody else. I was relieved that bookmakers were offering typically 100/1 against West Brom being relegated. My own assessment of risk is, of course, contaminated with personal anxiety so I was pleased that the crowd was more phlegmatic.

However, while I was on the online bookmaker’s website, I couldn’t help but notice that they were also accepting bets on the imminent birth of the royal baby, the next child of the Duke and Duchess of Cambridge. It struck me as weird that anyone would bet on the sex of the royal baby. Surely this was a mere coin toss, though I know that people will bet on that. Being hopelessly inquisitive I had a look. I was somewhat astonished to find these odds being offered (this was 22 April 2015, ten days before the royal birth).

odds implied probability
Girl 1/2 0.67
Boy 6/4 0.40
 Total 1.07

Here I have used the usual formula for converting between odds and implied probabilities: odds of m / n against an event imply a probability of n / (m + n) of the event occurring. Of course, the principle of finite additivity requires that probabilities add up to one. Here they don’t and there is an overround of 7%. Like the rest of us, bookmakers have to make a living and I was unsurprised to find a Dutch book.

The odds certainly suggested that the crowd thought a girl manifestly more probable than a boy. Bookmakers shorten the odds on the outcome that is attracting the money to avoid a heavy payout on an event that the crowd seems to know something about.

Historical data on sex ratio

I started, at this stage, to doubt my assumption that boy/ girl represented no more than a coin toss, 50:50, an evens bet. As with most things, sex ratio turns out to be an interesting subject. I found this interesting research paper which showed that sex ratio was definitely dependent on factors such as the age and ethnicity of the mother. The narrative of this chart was very interesting.

Sex ratio

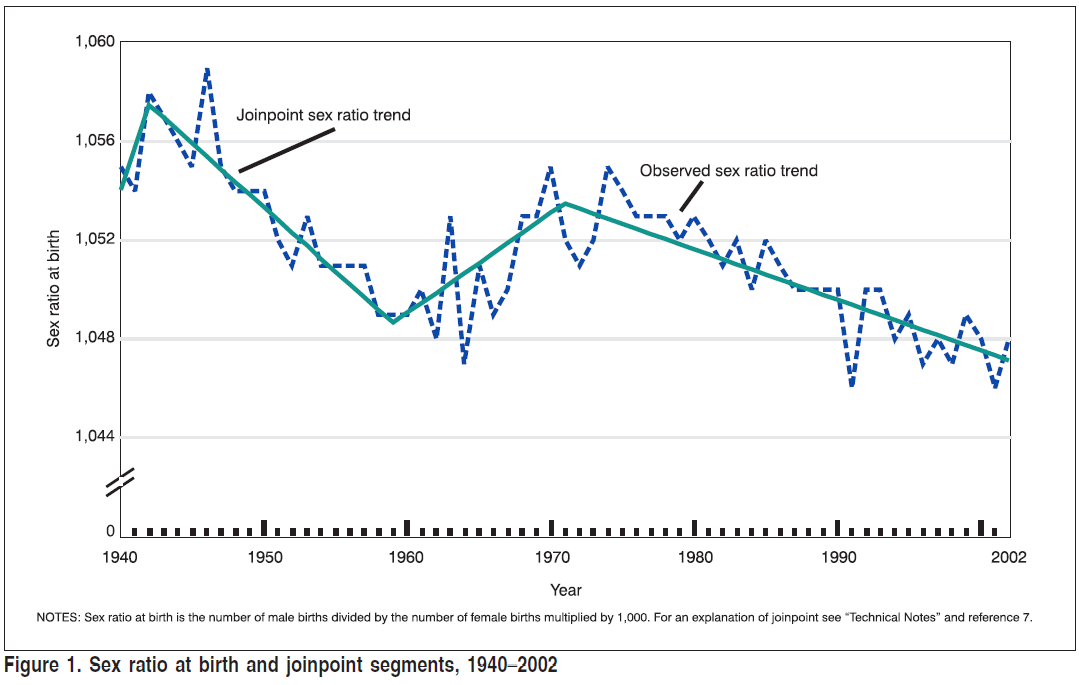
However, the paper confirmed that the sex of a baby is independent of previous births, conditioned on the factors identified, and that the ratio of girls to boys is nowhere and no time greater than 1,100 to 1000, about 52% girls.

So why the odds?

Bookmakers lengthen the odds on the outcome attracting the smaller value of bets in order to encourage stakes on the less fancied outcomes, on which there is presumably less risk of having to pay out. At odds of 6/4, a punter betting £10 on a boy would receive his stake back plus £15 ( = 6 × £10 / 4 ). If we assume an equal chance of boy or girl then that is an expected return of £12.50 ( = 0.5 × £25 ) for a £10.00 stake. I’m not sure I’d seen such a good value wager since we all used to bet against Tim Henman winning Wimbledon.

Ex ante there are two superficially suggestive explanations as to the asymmetry in the odds. At least this is all my bounded rationality could imagine.

  • A lot of people (mistakenly) thought that the run of five male royal births (Princes Andrew, Edward, William, Harry and George) escalated the probability of a girl being next. “It was overdue.”
  • A lot of people believed that somebody “knew something” and that they knew what it was.

In his book about cognitive biases in decision making (Thinking, Fast and Slow, Allen Lane, 2011) Nobel laureate economist Daniel Kahneman describes widespread misconceptions concerning randomness of boy/ girl birth outcomes (at p115). People tend to see regularity in sequences of data as evidence of non-randomness, even where patterns are typical of, and unsurprising in, random events.

I had thought that there could not be sufficient gamblers who would be fooled by the baseless belief that a long run of boys made the next birth more likely to be a girl. But then Danny Finkelstein reminded me (The (London) Times, Saturday 25 April 2015) of a survey of UK politicians that revealed their limited ability to deal with chance and probabilities. Are politicians more or less competent with probabilities than online gamblers? That is a question for another day. I could add that the survey compared politicians of various parties but we have an on-going election campaign in the UK at the moment so I would, in the interest of balance, invite my voting-age UK readers not to draw any inferences therefrom.

The alternative is the possibility that somebody thought that somebody knew something. The parents avowed that they didn’t know. Medical staff may or may not have. The sort of people who work in VIP medicine in the UK are not the sort of people who divulge information. But one can imagine that a random shift in sentiment, perhaps because of the misconception that a girl was “overdue”, and a consequent drift in the odds, could lead others to infer that there was insight out there. It is not completely impossible. How many other situations in life and business does that model?

It’s a girl!

The wisdom of crowds or pure luck? We shall never know. I think it was Thomas Mann who observed that the best proof of the genuineness of a prophesy was that it turned out to be false. Had the royal baby been a boy we could have been sure that the crowd was mad.

To be complete, Bayes’ theorem tells us that the outcome should enhance our degree of belief in the crowd’s wisdom. But it is a modest increase (Bayes’ factor of 2, 3 deciban after Alan Turing’s suggestion) and as we were most sceptical before we remain unpersuaded.

In his book, Surowiecki identified five factors that can impair crowd intelligence. One of these is homogeneity. Insufficient diversity frustrates the inherent virtue on which the principle is founded. I wonder how much variety there is among online punters? Similarly, where judgments are made sequentially there is a danger of influence. That was surely a factor at work here. There must also have been an element of emotion, the factor that led to all those unrealistically short odds on Henman at Wimbledon on which the wise dined so well.

But I’m trusting that none of that applies to the West Brom odds.

Deconstructing Deming X – Eliminate slogans!

10. Eliminate slogans, exhortations and targets for the workforce.

W Edwards Deming

Neither snow nor rain nor heat nor gloom of night stays these couriers from the swift completion of their appointed rounds.

Inscription on the James Farley Post Office, New York City, New York, USA
William Mitchell Kendall pace Herodotus

Now, that’s what I call a slogan. Is this what Point 10 of Deming’s 14 Points was condemning? There are three heads here, all making quite distinct criticisms of modern management. The important dimension of this criticism is the way in which managers use data in communicating with the wider organisation, in setting imperatives and priorities and in determining what individual workers will consider important when they are free from immediate supervision.

Eliminate slogans!

The US postal inscription at the head of this blog certainly falls within the category of slogans. Apparently the root of the word “slogan” is the Scottish Gaelic sluagh-ghairm meaning a battle cry. It seeks to articulate a solidarity and commitment to purpose that transcends individual doubts or rationalisation. That is what the US postal inscription seeks to do. Beyond the data on customer satisfaction, the demands of the business to protect and promote its reputation, the service levels in place for individual value streams, the tension between current performance and aspiration, the disappointment of missed objectives, it seeks to draw together the whole of the organisation around an ideal.

Slogans are part of the broader oral culture of an organisation. In the words of Lawrence Freedman (Strategy: A History, Oxford, 2013, p564) stories, and I think by extension slogans:

[make] it possible to avoid abstractions, reduce complexity, and make vital points indirectly, stressing the importance of being alert to serendipitous opportunities, discontented staff, or the one small point that might ruin an otherwise brilliant campaign.

But Freedman was quick to point out the use of stories by consultants and in organisations frequently confused anecdote with data. They were commonly used selectively and often contrived. Freedman sought to extract some residual value from the culture of business stories, in particular drawing on the work of psychologist Jerome Bruner along with Daniel Kahneman’s System 1 and System 2 thinking. The purpose of the narrative of an organisation, including its slogans and shared stories, is not to predict events but to define a context for action when reality is inevitably overtaken by a special cause.

In building such a rich narrative, slogans alone are an inert and lifeless tactic unless woven with the continual, rigorous criticism of historical data. In fact, it is the process behaviour chart that acts as the armature around which the narrative can be wound. Building the narrative will be critical to how individuals respond to the messages of the chart.

Deming himself coined plenty of slogans: “Drive out fear”, “Create joy in work”, … . They are not forbidden. But to be effective they must form a verisimilar commentary on, and motivation for, the hard numbers and ineluctable signals of the process behaviour chart.

Eliminate exhortations!

I had thought I would dismiss this in a single clause. It is, though, a little more complicated. The sports team captain who urges her teammates onwards to take the last gasp scoring opportunity doesn’t necessarily urge in vain. There is no analysis of this scenario. It is only muscle, nerve, sweat and emotion.

The English team just suffered a humiliating exit from the Cricket World Cup. The head coach’s response was “We’ll have to look at the data.” Andrew Miller in The Times (London) (10 March 2015) reflected most cricket fans’ view when he observed that “a team of meticulously prepared cricketers suffered a collective loss of nerve and confidence.” Exhortations might not have gone amiss.

It is not, though, a management strategy. If your principal means of managing risk, achieving compelling objectives, creating value and consistently delivering customer excellence, day in, day out is to yell “one more heave!” then you had better not lose your voice. In the long run, I am on the side of the analysts.

Slogans and exhortations will prove a brittle veneer on a stable system of trouble (RearView). It is there that they will inevitably corrode engagement, breed cynicism, foster distrust, and mask decline. Only the process behaviour chart can guard against the risk.

Eliminate targets for the workforce!

This one is more complicated. How do I communicate to the rest of the organisation what I need from them? What are the consequences when they don’t deliver? How do the rest of the organisation communicate with me? This really breaks down into two separate topics and they happen to be the two halves of Deming’s Point 11.

I shall return to those in my next two posts in the Deconstructing Deming series.


Is data the plural of anecdote?

I seem to hear this intriguing quote everywhere these days.

The plural of anecdote is not data.

There is certainly one website that traces it back to Raymond Wolfinger, a political scientist from Berkeley, who claims to have said sometime around 1969 to 1970:

The plural of anecdote is data.

So, which is it?

Anecdote

My Concise Oxford English Dictionary (“COED”) defines “anecdote” as:

Narrative … of amusing or interesting incident.

Wiktionary gives a further alternative definition.

An account which supports an argument, but which is not supported by scientific or statistical analysis.

Edward Jenner by James Northcote.jpg

It’s clear that anecdote itself is a concept without a very exact meaning. It’s a story, not usually reported through an objective channel such as a journalism, or scientific or historical research, that carries some implication of its own unreliability. Perhaps it is inherently implausible when read against objective background evidence. Perhaps it is hearsay or multiple hearsay.

The anecdote’s suspect reliability is offset by the evidential weight it promises, either as a counter example to a cherished theory or as compelling support for a controversial hypothesis. Lyall Watson’s hundredth monkey story is an anecdote. So, in eighteenth century England, was the folk wisdom, recounted to Edward Jenner (pictured), that milkmaids were generally immune to smallpox.

Data

My COED defines “data” as:

Facts or impormation, esp[ecially] as basis for inference.

Wiktionary gives a further alternative definition.

Pieces of information.

Again, not much help. But the principal definition in the COED is:

Thing[s] known or granted, assumption or premise from which inferences may be drawn.

The suggestion in the word “data” is that what is given is the reliable starting point from which we can start making deductions or even inductive inferences. Data carries the suggestion of reliability, soundness and objectivity captured in the familiar Arthur Koestler quote.

Without the little hard bits of marble which are called “facts” or “data” one cannot compose a mosaic …

Yet it is common knowledge that “data” cannot always be trusted. Trust in data is a recurring theme in this blog. Cyril Burt’s purported data on the heritability of IQ is a famous case. There are legions of others.

Smart investigators know that the provenance, reliability and quality of data cannot be taken for granted but must be subject to appropriate scrutiny. The modern science of Measurement Systems Analysis (“MSA”) has developed to satisfy this need. The defining characteristic of anecdote is that it has been subject to no such scrutiny.

Evidence

Anecdote and data, as broadly defined above, are both forms of evidence. All evidence is surrounded by a penumbra of doubt and unreliability. Even the most exacting engineering measurement is accompanied by a recognition of its uncertainty and the limitations that places on its use and the inferences that can be drawn from it. In fact, it is exactly because such a measurement comes accompanied by a numerical characterisation of its precision and accuracy, that  its reliability and usefulness are validated.

It seems inherent in the definition of anecdote that it should not be taken at face value. Happenstance or wishful fabrication, it may not be a reliable basis for inference or, still less, action. However, it was Jenner’s attention to the smallpox story that led him to develop vaccination against smallpox. No mean outcome. Against that, the hundredth monkey storey is mere fantastical fiction.

Anecdotes about dogs sniffing out cancer stand at the beginning of the journey of confirmation and exploitation.

Two types of analysis

Part of the answer to the dilemma comes from statistician John Tukey’s observation that there are two kinds of data analysis: Exploratory Data Analysis (“EDA”) and Confirmatory Data Analysis (“CDA”).

EDA concerns the exploration of all the available data in order to suggest some interesting theories. As economist Ronald Coase put it:

If you torture the data long enough, it will confess.

Once a concrete theory or hypothesis is to mind, a rigorous process of data generation allows formal statistical techniques to be brought to bear (“CDA”) in separating the signal in the data from the noise and in testing the theory. People who muddle up EDA and CDA tend to get into difficulties. It is a foundation of statistical practice to understand the distinction and its implications.

Anecdote may be well suited to EDA. That’s how Jenner successfully proceeded though his CDA of testing his vaccine on live human subjects wouldn’t get past many ethics committees today.

However, absent that confirmatory CDA phase, the beguiling anecdote may be no more than the wrecker’s false light.

A basis for action

Tukey’s analysis is useful for the academic or the researcher in an R&D department where the environment is not dynamic and time not of the essence. Real life is more problematic. There is not always the opportunity to carry out CDA. The past does not typically repeat itself so that we can investigate outcomes with alternative factor settings. As economist Paul Samuelson observed:

We have but one sample of history.

History is the only thing that we have any data from. There is no data on the future. Tukey himself recognised the problem and coined the phrase uncomfortable science for inferences from observations whose repetition was not feasible or practical.

In his recent book Strategy: A History (Oxford University Press, 2013), Lawrence Freedman points out the risks of managing by anecdote “The Trouble with Stories” (pp615-618). As Nobel laureate psychologist Daniel Kahneman has investigated at length, our interpretation of anecdote is beset by all manner of cognitive biases such as the availability heuristic and base rate fallacy. The traps for the statistically naïve are perilous.

But it would be a fool who would ignore all evidence that could not be subjected to formal validation. With a background knowledge of statistical theory and psychological biases, it is possible to manage trenchantly. Bayes’ theorem suggests that all evidence has its value.

I think that the rather prosaic answer to the question posed at the head of this blog is that data is the plural of anecdote, as it is the singular, but anecdotes are not the best form of data. They may be all you have in the real world. It would be wise to have the sophistication to exploit them.

How to use data to scare people …

… and how to use data for analytics.

Crisis hit GP surgeries forced to turn away millions of patients

That was the headline on the Royal College of General Practitioners (“RCGP” – UK family physicians) website today. The catastrophic tone was elaborated in The (London) Times: Millions shut out of doctors’ surgeries (paywall).
Blutdruck.jpg
The GPs’ alarm was based on data from the GP Patient Survey which is a survey conducted on behalf or the National Health Service (“NHS”) by pollsters Ipsos MORI. The study is conducted by way of a survey questionnaire sent out to selected NHS patients. You can find the survey form here. Ipsos MORI’s careful analysis is here.

Participants were asked to recall their experience of making an appointment last time they wanted to. From this, the GPs have extracted the material for their blog’s lead paragraph.

GP surgeries are so overstretched due to the lack of investment in general practice that in 2015 on more than 51.3m occasions patients in England will be unable to get an appointment to see a GP or nurse when they contact their local practice, according to new research.

Now, this is not analysis. For the avoidance of doubt, the Ipsos MORI report cited above does not suffer from such tendentious framing. The RCGP blog features the following tropes of Langian statistical method.

  • Using emotive language such as “crisis”, “forced” and “turn away”.
  • Stating the cause of the avowed problem, “lack of investment”, without presenting any supporting argument.
  • Quoting an absolute number of affected patients rather than a percentage which would properly capture individual risk.
  • Casually extrapolating to a future round number, over 50 million.
  • Seeking to bolster their position by citing “new research”.
  • Failing to recognise the inevitable biases that beset human descriptions of past events.

Humans are notoriously susceptible to bias in how they recall and report past events. Psychologist Daniel Kahneman has spent a lifetime mapping out the various cognitive biases that afflict our thinking. The Ipsos MORI survey appears to me rigorously designed but no degree of rigour can eliminate the frailties of human memory, especially about an uneventful visit to the GP. An individual is much more likely to recall a frustrating attempt to make an appointment than a straightforward encounter.

Sometimes, such survey data will be the best we can do and will be the least bad guide to action though in itself flawed. As Charles Babbage observed:

Errors using inadequate data are much less than those using no data at all.

Yet the GPs’ use of this external survey data to support their funding campaign looks particularly out of place in this situation. This is a case where there is a better source of evidence. The point is that the problem under investigation lies entirely within the GPs’ own domain. The GPs themselves are in a vastly superior position to collect data on frustrated appointments, within their own practices. Data can be generated at the moment an appointment is sought. Memory biases and patient non-responses can be eliminated. The reasons for any diary difficulties can be recorded as they are encountered. And investigated before the trail has gone cold. Data can be explored within the practice, improvements proposed, gains measured, solutions shared on social media. The RCGP could play the leadership role of aggregating the data and fostering sharing of ideas.

It is only with local data generation that the capability of an appointments system can be assessed. Constraints can be identified, managed and stabilised. It is only when the system is shown to be incapable that a case can be made for investment. And the local data collected is exactly the data needed to make that case. Not only does such data provide a compelling visual narrative of the appointment system’s inability to heal itself but, when supported by rigorous analysis, it liquidates the level of investment and creates its own business case. Rigorous criticism of data inhibits groundless extrapolation. At the very least, local data would have provided some borrowing strength to validate the patient survey.

Looking to external data to support a case when there is better data to be had internally, both to improve now what is in place and to support the business case for new investment, is neither pretty nor effective. And it is not analysis.

Target and the Targeteers

This blog appeared on the Royal Statistical Society website Statslife on 29 May 2014

DartboardJohn Pullinger, newly appointed head of the UK Statistics Authority, has given a trenchant warning about the “unsophisticated” use of targets. As reported in The Times (London) (“Targets could be skewing the truth, statistics chief warns”, 26 May 2014 – paywall) he cautions:

Anywhere we have had targets, there is a danger that they become an end in themselves and people lose sight of what they’re trying to achieve. We have numbers everywhere but haven’t been well enough schooled on how to use them and that’s where problems occur.

He goes on.

The whole point of all these things is to change behaviour. The trick is to have a sophisticated understanding of what will happen when you put these things out.

Pullinger makes it clear that he is no opponent of targets, but that in the hands of the unskilled they can create perverse incentives, encouraging behaviour that distorts the system they sought to control and frustrating the very improvement they were implemented to achieve.

For example, two train companies are being assessed by the regulator for punctuality. A train is defined as “on-time” if it arrives within 5 minutes of schedule. The target is 95% punctuality.
TrainTargets
Evidently, simple management by target fails to reveal that Company 1 is doing better than Company 2 in offering a punctual service to its passengers. A simple statement of “95% punctuality (punctuality defined as arriving within 5 minutes of timetable)” discards much of the information in the data.

Further, when presented with a train that has slipped outside the 5 minute tolerance, a manager held solely to the target of 95% has no incentive to stop the late train from slipping even further behind. Certainly, if it puts further trains at risk of lateness, there will always be a temptation to strip it of all priority. Here, the target is not only a barrier to effective measurement and improvement, it is a threat to the proper operation of the railway. That is the point that Pullinger was seeking to make about the behaviour induced by the target.

And again, targets often provide only a “snapshot” rather than the “video” that discloses the information in the data that can be used for planning and managing an enterprise.

I am glad that Pullinger was not hesitant to remind users that proper deployment of system measurement requires an appreciation of psychology. Nobel Laureate psychologist Daniel Kahneman warns of the inherent human trait of thinking that What you see is all there is (WYSIATI). On their own, targets do little to guard against such bounded rationality.

In support of a corporate programme of improvement and integrated in a culture of rigorous data criticism, targets have manifest benefits. They communicate improvement priorities. They build confidence between interfacing processes. They provide constraints and parameters that prevent the system causing harm. Harm to others or harm to itself. What is important is that the targets do not become a shield to weak managers who wish to hide their lack of understanding of their own processes behind the defence that “all targets were met”.

However, all that requires some sophistication in approach. I think the following points provide a basis for auditing how an organisation is using targets.

Risk assessment

Targets should be risk assessed, anticipating realistic psychology and envisaging the range of behaviours the targets are likely to catalyse.

Customer focus

Anyone tasked with operating to a target should be periodically challenged with a review of the Voice of the Customer and how their own role contributes to the organisational system. The target is only an aid to the continual improvement of the alignment between the Voice of the Process and the Voice of the Customer. That is the only game in town.

Borrowed validation

Any organisation of any size will usually have independent data of sufficient borrowing strength to support mutual validation. There was a very good recent example of this in the UK where falling crime statistics, about which the public were rightly cynical and incredulous, were effectively validated by data collection from hospital emergency departments (Violent crime in England and Wales falls again, A&E data shows).

Over-adjustment

Mechanisms must be in place to deter over-adjustment, what W Edwards Deming called “tampering”, where naïve pursuit of a target adds variation and degrades performance.

Discipline

Employees must be left in no doubt that lack of care in maintaining the integrity of the organisational system and pursuing customer excellence will not be excused by mere adherence to a target, no matter how heroic.

Targets are for the guidance of the wise. To regard them as anything else is to ask them to do too much.