The art of managing footballers

Van Persie (15300483040) (crop).jpg… or is it a science? Robin van Persie’s penalty miss against West Bromwich Albion on 2 May 2015 was certainly welcome news to my ears. It eased the relegation pressures on West Brom and allowed us to advance to 40 points for the season. Relegation fears are only “mathematical” now. However, the miss also resulted in van Persie being relieved of penalty taking duties, by Manchester United manager Louis van Gaal, until further notice.

He is now at the end of the road. It is always [like that]. Wayne [Rooney] has missed also so when you miss you are at the bottom again.

The Daily Mail report linked above goes on to say that van Persie had converted his previous 6 penalties.

Van Gaal was, of course, referring to Rooney’s shot over the crossbar against West Ham in February 2013, when Rooney had himself invited then manager Sir Alex Ferguson to retire him as designated penalty taker. Rooney’s record had apparently been 9 misses from 27 penalties. I have all this from this Daily Telegraph report.

I wonder if statistics can offer any insight into soccer management?

The benchmark

It was very difficult to find, very quickly, any exhaustive statistics on penalty conversion rates on the web. However, I would like to start by establishing what constituted “good” performance for a penalty taker. As a starting point I have looked at Table 2 on this Premier League website. The data is from February 2014 and shows, at that date, data on the players with the best conversion rates in the League’s history. Players who took fewer than 10 penalties were excluded. It shows that of the ten top converting players, who must rank as the very good if not the ten best, in the aggregate they converted 155 of 166 penalties. That is a conversion rate of 93.4%. At first sight that suggests a useful baseline against which to assess any individual penalty taker.

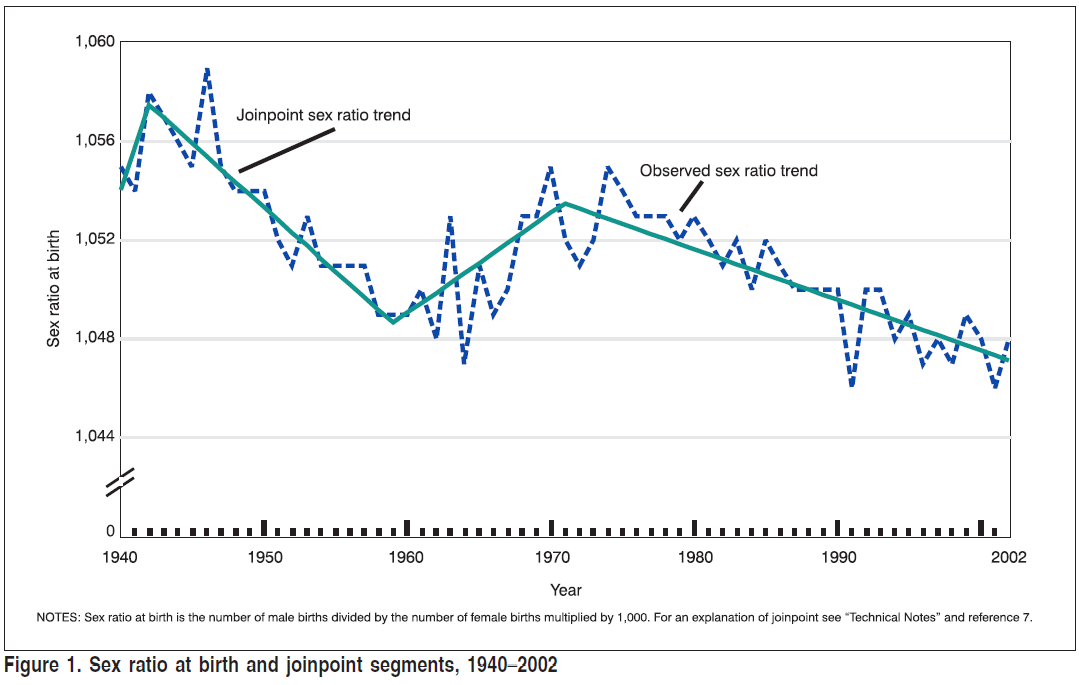
Several questions come to mind. The aggregate statistics do not tell us how individual players have developed over time, whether improving or losing their nerve. That said, it is difficult to perform that sort of analysis on these comparatively low volumes of data when collected in this way. There is however data (Table 4) on the overall conversion rate in the Premier League since its inception.

Penalties

That looks to me like a fairly stable system. That would be expected as players come and go and this is the aggregate of many effects. Perhaps there is latterly reduced season-to-season variation, which would be odd, but I am not really interested in that and have not pursued it. I am aware that during this period there has been a rule change allowing goalkeepers to move before the kick his taken but I have just spent 30 minutes on the web and failed to establish the date when that happened. The total aggregate statistics up to 2014 are 1,438 penalties converted out of 1,888. That is a conversion rate of 76.2%.

I did wonder if there was any evidence that some of the top ten players were better than others or whether the data was consistent with a common elite conversion rate of 93.4%. In that case the table positions would reflect nothing more than sampling variation. Somewhat reluctantly I calculated the chi-squared statistic for the table of successes and failures (I know! But what else to do?). The statistic came out as 2.02 which, with 9 degrees of freedom, has a p-value (I know!) of 0.8%. That is very suggestive of a genuine ranking among the elite penalty takers.

It inevitably follows that the elite are doing better than the overall success rate of 76.2%. Considering all that together I am happy to proceed with 93.4% as the sort of benchmark for a penalty taker that a team like Manchester United would aspire to.

Van Persie

This website, dated 6 Sept 2012, told me that van Persie had converted 18 penalties with a 77% success rate. That does not quite fit either 18/23 or 18/24 but let us take it at face value. If that is accurate then that is, more or less, the data on which Ferguson gave van Persie the job in February 2013. It is a surprising appointment given the Premier League average of 76.2% and the elite benchmark but perhaps it was the best that could be mustered from the squad.

Rooney’s 9 misses out of 27 yields a success rate of 67%. Not so much lower than van Persie’s historical performance but, in all the circumstances, it was not good enough.

The dismissal

What is fascinating is that, no matter what van Persie’s historical record on which he was appointed penalty taker, before his 2 May miss he had scored 6 out of 6. The miss made it 6 out of 7, 85.7%. That was his recent record of performance, even if selected to some extent to show him in a good light.

Selection of that run is a danger. It is often “convenient” to select a subset of data that favours a cherished hypothesis. Though there might be that selectivity, where was the real signal that van Persie had deteriorated or that the club would perform better were he replaced?

The process

Of course, a manager has more information than the straightforward success/ fail ratio. A coach may have observed goalkeepers increasingly guessing a penalty taker’s shot direction. There may have been many near-saves, a hesitancy on the part of the player, trepidation in training. Those are all factors that a manager must take into account. That may lead to the rotation of even the most impressive performer. Perhaps.

But that is not the process that van Gaal advocates. Keep scoring until you miss then go to the bottom of the list. The bottom! Even scorers in the elite-10 miss sometimes. Is it rational to then replace them with an alternative that will most likely be more average (i.e. worse)? And then make them wait until everyone else has missed.

With an average success rate of 76.2% it is more likely than not that van Persie’s replacement will score their first penalty. Van Gaal will be vindicated. That is the phenomenon called regression to the mean. An extreme event (a miss) is most likely followed by something more average (a goal). Economist Daniel Kahneman explores this at length in his book Thinking, Fast and Slow.

It is an odd strategy to adopt. Keep the able until they fail. Then replace them with somebody less able. But different.


Royal babies and the wisdom of crowds

Prince George of Cambridge with wombat plush toy (crop).jpgIn 2004 James Surowiecki published a book with the unequivocal title The Wisdom of Crowds: Why the Many Are Smarter Than the Few and How Collective Wisdom Shapes Business, Economies, Societies and Nations. It was intended as a gloss on Charles Mackay’s 1841 book Extraordinary Popular Delusions and the Madness of Crowds. Both books are essential reading for any risk professional.

I am something of a believer in the wisdom of crowds. The other week I was fretting about the possible relegation of English Premier League soccer club West Bromwich Albion. It’s an emotional and atavistic tie for me. I always feel there is merit, as part of my overall assessment of risk, in checking online bookmakers’ odds. They surely represent the aggregated risk assessment of gamblers if nobody else. I was relieved that bookmakers were offering typically 100/1 against West Brom being relegated. My own assessment of risk is, of course, contaminated with personal anxiety so I was pleased that the crowd was more phlegmatic.

However, while I was on the online bookmaker’s website, I couldn’t help but notice that they were also accepting bets on the imminent birth of the royal baby, the next child of the Duke and Duchess of Cambridge. It struck me as weird that anyone would bet on the sex of the royal baby. Surely this was a mere coin toss, though I know that people will bet on that. Being hopelessly inquisitive I had a look. I was somewhat astonished to find these odds being offered (this was 22 April 2015, ten days before the royal birth).

odds implied probability
Girl 1/2 0.67
Boy 6/4 0.40
 Total 1.07

Here I have used the usual formula for converting between odds and implied probabilities: odds of m / n against an event imply a probability of n / (m + n) of the event occurring. Of course, the principle of finite additivity requires that probabilities add up to one. Here they don’t and there is an overround of 7%. Like the rest of us, bookmakers have to make a living and I was unsurprised to find a Dutch book.

The odds certainly suggested that the crowd thought a girl manifestly more probable than a boy. Bookmakers shorten the odds on the outcome that is attracting the money to avoid a heavy payout on an event that the crowd seems to know something about.

Historical data on sex ratio

I started, at this stage, to doubt my assumption that boy/ girl represented no more than a coin toss, 50:50, an evens bet. As with most things, sex ratio turns out to be an interesting subject. I found this interesting research paper which showed that sex ratio was definitely dependent on factors such as the age and ethnicity of the mother. The narrative of this chart was very interesting.

Sex ratio

However, the paper confirmed that the sex of a baby is independent of previous births, conditioned on the factors identified, and that the ratio of girls to boys is nowhere and no time greater than 1,100 to 1000, about 52% girls.

So why the odds?

Bookmakers lengthen the odds on the outcome attracting the smaller value of bets in order to encourage stakes on the less fancied outcomes, on which there is presumably less risk of having to pay out. At odds of 6/4, a punter betting £10 on a boy would receive his stake back plus £15 ( = 6 × £10 / 4 ). If we assume an equal chance of boy or girl then that is an expected return of £12.50 ( = 0.5 × £25 ) for a £10.00 stake. I’m not sure I’d seen such a good value wager since we all used to bet against Tim Henman winning Wimbledon.

Ex ante there are two superficially suggestive explanations as to the asymmetry in the odds. At least this is all my bounded rationality could imagine.

  • A lot of people (mistakenly) thought that the run of five male royal births (Princes Andrew, Edward, William, Harry and George) escalated the probability of a girl being next. “It was overdue.”
  • A lot of people believed that somebody “knew something” and that they knew what it was.

In his book about cognitive biases in decision making (Thinking, Fast and Slow, Allen Lane, 2011) Nobel laureate economist Daniel Kahneman describes widespread misconceptions concerning randomness of boy/ girl birth outcomes (at p115). People tend to see regularity in sequences of data as evidence of non-randomness, even where patterns are typical of, and unsurprising in, random events.

I had thought that there could not be sufficient gamblers who would be fooled by the baseless belief that a long run of boys made the next birth more likely to be a girl. But then Danny Finkelstein reminded me (The (London) Times, Saturday 25 April 2015) of a survey of UK politicians that revealed their limited ability to deal with chance and probabilities. Are politicians more or less competent with probabilities than online gamblers? That is a question for another day. I could add that the survey compared politicians of various parties but we have an on-going election campaign in the UK at the moment so I would, in the interest of balance, invite my voting-age UK readers not to draw any inferences therefrom.

The alternative is the possibility that somebody thought that somebody knew something. The parents avowed that they didn’t know. Medical staff may or may not have. The sort of people who work in VIP medicine in the UK are not the sort of people who divulge information. But one can imagine that a random shift in sentiment, perhaps because of the misconception that a girl was “overdue”, and a consequent drift in the odds, could lead others to infer that there was insight out there. It is not completely impossible. How many other situations in life and business does that model?

It’s a girl!

The wisdom of crowds or pure luck? We shall never know. I think it was Thomas Mann who observed that the best proof of the genuineness of a prophesy was that it turned out to be false. Had the royal baby been a boy we could have been sure that the crowd was mad.

To be complete, Bayes’ theorem tells us that the outcome should enhance our degree of belief in the crowd’s wisdom. But it is a modest increase (Bayes’ factor of 2, 3 deciban after Alan Turing’s suggestion) and as we were most sceptical before we remain unpersuaded.

In his book, Surowiecki identified five factors that can impair crowd intelligence. One of these is homogeneity. Insufficient diversity frustrates the inherent virtue on which the principle is founded. I wonder how much variety there is among online punters? Similarly, where judgments are made sequentially there is a danger of influence. That was surely a factor at work here. There must also have been an element of emotion, the factor that led to all those unrealistically short odds on Henman at Wimbledon on which the wise dined so well.

But I’m trusting that none of that applies to the West Brom odds.

Science journal bans p-values

p-valueInteresting news here that psychology journal Basic and Applied Social Psychology (BASP) has banned the use of p-values in the academic research papers that it will publish in the future.

The dangers of p-values are widely known though their use seems to persist in any number of disciplines, from the Higgs boson to climate change.

There has been some wonderful recent advocacy deprecating p-values, from Deirdre McCloskey and Regina Nuzzo among others. BASP editor David Trafimow has indicated that the journal will not now publish formal hypothesis tests (of the Neyman-Pearson type) or confidence intervals purporting to support experimental results. I presume that appeals to “statistical significance” are proscribed too. Trafimow has no dogma as to what people should do instead but is keen to encourage descriptive statistics. That is good news.

However, Trafimow does say something that worries me.

… as the sample size increases, descriptive statistics become increasingly stable and sampling error is less of a problem.

It is trite statistics that merely increasing sample size, as in the raw number of observations, is no guarantee of improving sampling error. If the sample is not rich enough to capture all the relevant sources of variation then data is amassed in vain. A common example is that of inter-laboratory studies of analytical techniques. A researcher who takes 10 observations from Laboratory A and 10 from Laboratory B really only has two observations. At least as far as the really important and dominant sources of variation are concerned. Increasing the number of observations to 100 from each laboratory would simply be a waste of resources.

But that is not all there is to it. Sampling error only addresses how well we have represented the sampling frame. In any reasonably interesting statistics, and certainly in any attempt to manage risk, we are only interested in the future. The critical question before we can engage in any, even tentative, statistical inference is “Is the data representative of the future?”. That requires that the data has the statistical property of exchangeability. Some people prefer the more management-oriented term “stable and predictable”. That’s why I wished Trafimow hadn’t used the word “stable”.

Assessment of stability and predictability is fundamental to any prediction or data based management. It demands confident use of process-behaviour charts and trenchant scrutiny of the sources of variation that drive the data. It is the necessary starting point of all reliable inference. A taste for p-values is a major impediment to clear thinking on the matter. They do not help. It would be encouraging to believe that scepticism was on the march but I don’t think prohibition is the best means of education.


Ninety years on

Walter ShewhartOn 16 May 1924, ninety years ago today, Walter Shewhart sent his manager a short memo, no longer than one page. Shewhart described what came to be called the control chart, what we would today call a process behaviour chart.

Shewhart, a physicist by training and engineer by avocation, had been involved in improving the reliability of radio and telegraph hardware for the Western Electric Company. Equipment buried underground was often costly to repair and maintain. Shewhart had realised that the key to reliability improvement was reduction in manufactured product variation. If variation could, hypothetically, be eliminated then everything would work or everything would fail. If everything failed it would soon be fixed. Variability confounded improvement efforts.

Shewhart shared a profound insight about variation with a diverse group of independent contemporaries including Bruno de Finetti and W E Johnson. If we wanted to be able to reduce variation, we had to be able to predict it. Working to reduce variation turned on the ability to predict future behaviour.

De Finetti and Johnson were philosophers who didn’t go as far as turning their ideas into instrumental tools. The control chart turned out to be the silver bullet for predicting the future. It is a convivial tool. Shewhart invented it ninety years ago today.

If it isn’t supporting and guiding your predictions, you’re ninety years out of date (assuming that you’re reading today).

See the RearView tab at the top of the page for further background.

A personal brush with existential risk

Blutdruck.jpgI visited my GP (family physician) last week on a minor matter which I am glad to say is now cleared up totally. However, the receptionist was very eager to point out that I had not taken up my earlier invitation to a cardiovascular assessment. I suspect there was some financial incentive for the practice. I responded that I was uninterested. I knew the general lifestyle advice being handed out and how I felt about it. However, she insisted and it seemed she would never book me in for my substantive complaint unless I agreed. So I agreed.

I had my blood pressure measured (ok), and good and bad cholesterol (both ok which was a surprise). Finally, the nurse gave me a percentage risk of cardiovascular disease. The number wasn’t explained and I had to ask if the number quoted was the annual risk of contracting cardiovascular disease (that’s what I had assumed) or something else. However, it turned out to be the total risk over the next decade. The quoted risk was much lower than I would have guessed so I feel emboldened in my lifestyle. The campaign’s efforts to get me to mend my ways backfired.

Of course, I should not take this sort of thing at face value. The nurse was unable to provide me with any pseudo-R2 for the logistic regression or even the Hosmer–Lemeshow statistic for that matter.

I make light of the matter but logistic regression is very much in vogue at the moment. It provides some of the trickiest issues in analysing model quality and any user would be naïve to rely on it as a basis for action without understanding whether it really was explaining any variation in outcome. Issues of stability and predictability (see Rear View tab at the head of this page) get even less attention because of their difficulty. However, issues of model quality and exchangeability do not go away because they are alien to the analysis.

When governments offer statistics such as this, we risk cynicism and disengagement if we ask the public to take them more glibly than we would ourselves.