The future of p-values

Another attack on p-values. This time by Regina Nuzzo in prestigious science journal Nature. Nuzzo advances the usual criticisms clearly and trenchantly. I hope that this will start to make people think hard about using probability to make decisions.

However, for me, the analysis still does not go deep enough. US baseball commentator Yogi Berra is reputed once to have observed that:

It’s tough to make predictions, especially about the future.

The fact that scientists work with confidence intervals, whereas if society is interested in such things it is interested in prediction intervals, belies the proper recognition of the future in much scientific writing.

The principal reason for doing statistics is to improve the reliability of predictions and forecasts. But the foundational question is whether the past is even representative of the future. Unless the past is representative of the future then it is of no assistance in forecasting. Many statisticians have emphasised the important property that any process must display to allow even tentative predictions about its future behaviour. Johnson and de Finetti called the property exchangeability, Shewhart and Deming called it statistical control, Don Wheeler coined the more suggestive term stable and predictable.

Shewhart once observed:

Both pure and applied science have gradually pushed further and further the requirements for accuracy and precision. However, applied science, particularly in the mass production of interchangeable parts, is even more exacting than pure science in certain matters of accuracy and precision.

Perhaps its unsurprising then that the concept is more widely relied upon in business than in scientific writing. All the same, statistical analysis begins and ends with considerations of stability. An analysis in which p-values do not assist.

At the head of this page is a tab labelled “Rearview” where I have surveyed the matter more widely. I would like to think of this as supplementary to Nuzzo’s views.

Deconstructing Deming III – Cease reliance on inspection

3. Cease dependence on inspection to achieve quality. Eliminate the need for massive inspection by building quality into the product in the first place.

W Edwards Deming Point 3 of Deming’s 14 Points. This at least cannot be controversial. For me it goes to the heart of Deming’s thinking.

The point is that every defective item produced (or defective service delivered) has taken cash from the pockets of customers or shareholders. They should be more angry. One day they will be. Inputs have been purchased with their cash, their resources have been deployed to transform the inputs and they will get nothing back in return. They will even face the costs of disposing of the scrap, especially if it is environmentally noxious.

That you have an efficient system for segregating non-conforming from conforming is unimpressive. That you spend even more of other people’s money reworking the product ought to be a matter of shame. Lean Six Sigma practitioners often talk of the hidden factory where the rework takes place. A factory hidden out of embarrassment. The costs remain whether you recognise them or not. Segregation is still more problematic in service industries.

The insight is not unique to Deming. This is a common theme in Lean, Six Sigma, Theory of Constraints and other approaches to operational excellence. However, Deming elucidated the profound statistical truths that belie the superficial effectiveness of inspection.

Inspection is inefficient

When I used to work in the railway industry I was once asked to look at what percentage of signalling scheme designs needed to be rechecked to defend against the danger of a logical error creeping through. The problem requires a simple application of Bayes’ theorem. I was rather taken aback at the result. There were only two strategies that made sense: recheck everything or recheck nothing. I didn’t at that point realise that this is a standard statistical result in inspection theory. For a wide class of real world situations, where the objective is to segregate non-conforming from conforming, the only sensible sampling schemes are 100% or 0%.

Where the inspection technique is destructive, such as a weld strength test, there really is only one option.

Inspection is ineffective

All inspection methods are imperfect. There will be false-positives and false-negatives. You will spend some money scrapping product you could have sold for cash. Some defective product will escape onto the market. Can you think of any examples in your own experience? Further, some of the conforming product will be only marginally conforming. It won’t delight the customer.

So build quality into the product

… and the process for producing the product (or delivering the service). Deming was a champion of the engineering philosophy of Genechi Taguchi who put forward a three-stage approach for achieving, what he called, off-line quality control.

  1. System design – in developing a product (or process) concept think about how variation in inputs and environment will affect performance. Choose concepts that are robust against sources of variation that are difficult or costly to control.
  2. Parameter design – choose product dimensions and process settings that minimise the sensitivity of performance to variation.
  3. Tolerance design – work out the residual sources of variation to which performance remains sensitive. Develop control plans for measuring, managing and continually reducing such variation.

Is there now no need to measure?

Conventional inspection aimed at approving or condemning a completed batch of output. The only thing of interest was the product and whether it conformed. Action would be taken on the batch. Deming called the application of statistics to such problems an enumerative study.

But the thing managers really need to know about is future outcomes and how they will be influenced by present decisions. There is no way of sampling the future. So sampling of the past has to go beyond mere characterisation and quantification of the outcomes. You are stuck with those and will have to take the consequences one way or another. Sampling (of the past) has to aim principally at understanding the causes of those historic outcomes. Only that enables managers to take a view on whether those causes will persist in the future, in what way they might change and how they might be adjusted. This is what Deming called an analytic study.

Essential to the ability to project data into the future is the recognition of common and special causes of variation. Only when managers are confident in thinking and speaking in those terms will their organisations have a sound basis for action. Then it becomes apparent that the results of inspection represent the occult interaction of inherent variation with threshold effects. Inspection obscures the distinction between common and special causes. It seduces the unwary into misguided action that exacerbates quality problems and reputational damage. It obscures the sad truth that, as Terry Weight put it, a disappointment is not necessarily a surprise.

The programme

  1. Drive out sensitivity to variation at the design stage.
  2. Routinely measure the inputs whose variation threatens product performance.
  3. Measure product performance too. Your bounded rationality may have led you to get (2) wrong.
  4. No need to measure every unit. We are trying to understand the cause system not segregate items.
  5. Plot data on a process behaviour chart.
  6. Stabilise the system.
  7. Establish capability.
  8. Keep on measuring to maintain stability and improve capability.

Some people think they have absorbed Deming’s thinking, mastered it even. Yet the test is the extent to which they are able to analyse problems in terms of common and special causes of variation. Is that the language that their organisation uses to communicate exceptions and business performance, and to share analytics, plans, successes and failures?

There has always been some distaste for Deming’s thinking among those who consider it cold, statistically driven and paralysed by data. But the data are only a means to getting beyond the emotional reaction to those two impostors: triumph and disaster. The language of common and special causes is a profound tool for building engagement, fostering communication and sharing understanding. Above that, it is the only sound approach to business measurement.

Trust in forecasting

File:City of London skyline at dusk.jpgStephen King (global economist at HSBC) made some profound comments about forecasting in The Times (London) (paywall) yesterday.

He points out that it is only a year since the International Monetary Fund (IMF) criticised UK economic strategy and forecast 0.7% GDP growth in 2013 and 1.5% in 2014. The latest estimate for 2013 is growth is 1.9%. The IMF now forecasts growth for 2014 at 2.4% and notes the strength of the UK economy. I should note that the UK Treasury’s forecasts were little different from the IMF’s.

Why, asks King, should we take any notice of the IMF forecast, or their opinions, now when they are so unapologetic about last year’s under estimate and their supporting comments?

The fact is that any forecast should come attached to an historic record of previous forecasts and actual outcomes, preferably on a deviation from aim chart. In fact, wherever somebody offers a forecast and there is no accompanying historic deviation from aim chart, I think it a reasonable inference that they have something to hide. The critical matter is that the chart must show a stable and predictable process of forecasting. If it does then we can start to make tentative efforts at estimating accuracy and precision. If not then there is simply no rational forecast. It would be generous to characterise such attempts at foresight as guesses.

Despite the experience base, forecasting is all about understanding fundamentals. King goes on to have doubts about the depth of the UK’s recovery and, in particular, concerns about productivity. The ONS data is here. He observes that businesses are choosing to expand by hiring cheap labour and suggests macroeconomic remedies to foster productivity growth such as encouraging small and medium sized enterprises, and enhancing educational effectiveness.

It comes back to a paradox that I have discussed before. There is a well signposted path to improved productivity that seems to remain The Road Not Taken. Everyone says they do it but it is clear from King’s observations on productivity that, in the UK at least, they do not. That would be consistent with the chronically poor service endemic in several industries. Productivity and quality go hand in hand.

I wonder if there is a preference in the UK for hiring state subsidised cheap labour over the rigorous and sustained thinking required to make real productivity improvements. I have speculated elsewhere that producers may feel themselves trading in a market for lemons. The macroeconomic causes of low productivity growth are difficult for non-economists such as myself to divine.

However, every individual company has the opportunity to take its own path and “Put its sticker on a lemon”. Governments may look to societal remedies but as an indefatigable female politician once trenchantly put it:

The individual is the true reality in life. A cosmos in himself, he does not exist for the State, nor for that abstraction called “society,” or the “nation,” which is only a collection of individuals. Man, the individual, has always been and, necessarily is the sole source and motive power of evolution and progress.

Emma Goldman
The Individual, Society and the State, 1940

How to use data to promote your business

… or alternatively, five ways not to. Quite by chance, I recently came upon a paper by Neil H. Spencer and Lindsey Kevan de Lopez at the Statistical Services and Consultancy Unit of the University of Hertfordshire Business School entitled “Item-by-item sampling for promotional purposes”.

The abstract declares the aim of the paper.

In this paper we present a method for sampling items that are checked on a pass/fail basis, with a view to a claim being made about the success/failure rate for the purposes of promoting a company’s product/service.

The sort of statements the authors want to validate occur where all items outside some specification are classed as defective. I would hope that most organisations would want to protect the customer from defects like these but the authors of the paper seem to want to predicate their promotion on the defects’ escape. The statements are of the type:

There is a 95% probability that the true proportion of trains delayed by more than 5 minutes is less than 5%.

— or:

There is a 95% probability that the true proportion of widgets with diameter more than 1% from nominal is less than 5%.

I can see five reasons why you really shouldn’t try to promote your business with statements like this.

1. Telling your customers that your products are defective

Or to put it another way “Some of our products are defective. You might get one.” This might be a true statement at your current level of quality maturity but it is not something to shout at customers. All these statements do is to germinate doubt about your product in the customer’s mind. Customers want products and services that simply perform. Making customers think that they might not will be a turn off.

Customers will not think it okay to end up with a defective item or outcome. They will not put it down just to the “luck of the draw”. The products will come back but the customers won’t.

If you are lucky then your customer won’t even understand this type of promotional statement. There are just too many percentages. But they might remember the word “defect”.

2. Tolerating defects

Or to put it another way “Some of our products are defective and we don’t care.” Quoting the 5% defective with pride suggests that the producer thinks it okay to make and sell defects. In the 1980s Japanese motor manufacturers such as Toyota seized market share by producing reliable vehicles and using that as a basis for marketing and creating a reputation for quality.

Any competitive market is destined to go that way eventually. Paradoxically, what Toyota and others discovered is that the things you have to do to make things more reliable are the same things that reduce costs. Low price and high quality goods and services have an inbuilt advantage in penetrating markets.

3. Saying nothing about the product the customer is considering buying

The telling phrase is “true proportion of” trains/ widgets. As a matter of strict statistical technicality, Spencer and de Lopez don’t describe any “method for sampling” at all. They only describe a method of calculating sample size, worked out using Bayes’ theorem. Because they use the word “true”, it can only be that they were presuming what W Edwards Deming called an enumerative study, a characterisation of a particular sampling frame that yields information only about that frame. They took a particular slice of output and sampled that. Such a study is incapable of saying anything about future widgets or trains.

Put another way, “When we looked at a slice of our products we’re pretty sure that no more than 5% were defective. We don’t care. As to future products, we don’t know. Yours may be defective.”

I think we need a name for soi-disant Bayesians who chronically fail to address issues of exchangeability (stability and predictability).

4. Throwing away most of the valuable information on your product

Looking at the train example, “5% more than 5 minutes late” may mean:

  • “5% were 6 minutes late, the rest were 4 minutes late”; or
  • “4% were one hour late, 1% were cancelled and the rest were on time”; or

These various scenarios will have wholly different psychological and practical impacts on customers. Customers care which will happen to them.

Further, where we actually measure delay in minutes or diameter in millimetres, that is data that can be used to improve the business process and, with diligence, achieve the sort of excellence where quality failures and defects simply do not happen. That then provides the sort of consumer experience of satisfaction that can be developed into a public reputation for quality, performance and cost. That in turn supports promotional statements that will chime with customer aspirations and build business. Simply checking on a pass/ fail basis is an inadequate foundation for such improvement.

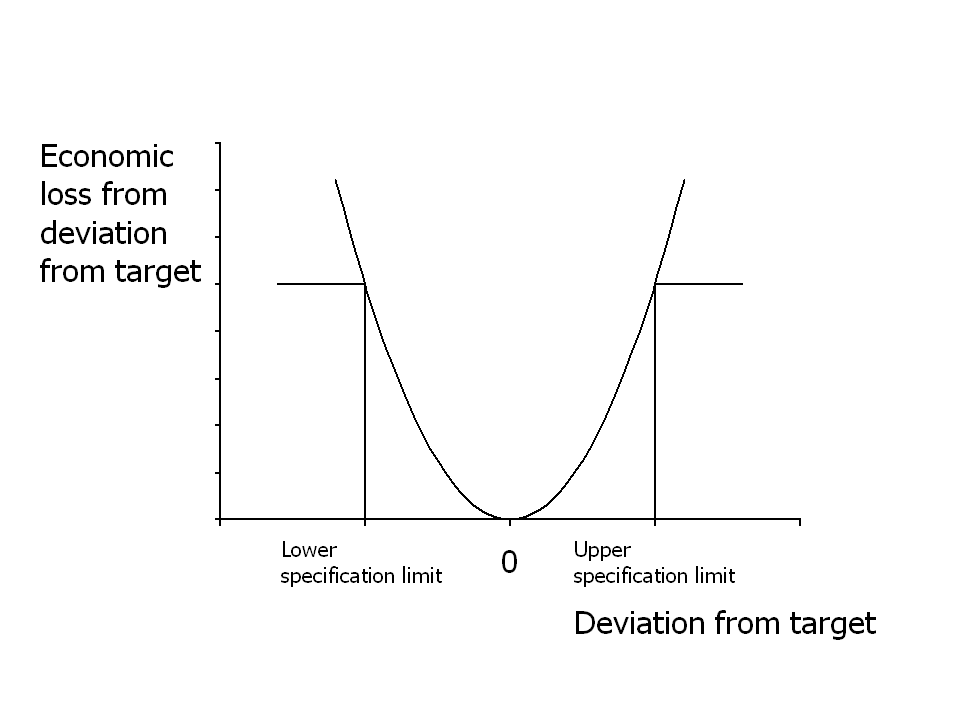
5. Managing by specifications

Taguchi1This is the subtlest point to turn your attention towards once everything is within specification. In the train example, the customer wants the train to be on time. Every deviation either side of that results in customer dissatisfaction. It also results in practical operating and timetable problems and costs for the railway. In the 1960s, Japanese statistician Genechi Taguchi put forward the idea that such losses should be recognised and form the basis of measuring improvement. The Taguchi loss function captures the idea that losses start with every departure from nominal and then start to escalate.

That leads to the practical insight that the improvement objective of any business process is “on target, minimum variation”.

What the Spencer-de Lopez statements ultimately say is that the vendor is willing to tolerate any train being 5 minutes late and 5% of trains being delayed even longer than that, perhaps indefinitely. Whether even that depressing standard is achieved in the future, who knows? Perhaps the customer will be lucky.

I fear that such statements will not promote your business. What will promote your business is using measurement to establish, maintain and improve process capability. That will provide the sort of excellent customer experience that can be mapped, promoted and fed back into confident, data based marketing campaigns aimed at enhancing reputation. Reputation supports talent recruitment and fosters a virtuous circle of excellence. This is what reputation management is about.

I do note that Spencer and de Lopez protest that this is only a working paper but it has been on their website since mid-2012 so I presume they are now owning the contents.

Just as a final caveat I think I should point out that the capability indices Cp and Cpk, though useful, do not measure Taguchi loss. That is the topic for another blog.

Rationing in UK health care – signal or noise?

The NHS in England appears to be rationing access to vital non-emergency hospital care, a review suggests.

This was the rather weaselly BBC headline last Friday. It referred to a report from Dr Foster Intelligence which appears to be a trading arm of Imperial College London.

The analysis alleged that the number of operations in three categories (cataract, knee and hip) had risen steadily between 2002 and 2008 but then “plateaued”. As evidence for this the BBC reproduced the following chart.

NHS_DrFoster_Dec13

Dr Foster Intelligence apparently argued that, as the UK population had continued to age since 2008, a “plateau” in the number of such operations must be evidence of “rationing”. Otherwise the rising trend would have continued. I find myself using a lot of quotes when I try to follow the BBC’s “data journalism”.

Unfortunately, I was unable to find the report or the raw data on the Dr Foster Intelligence website. It could be that my search skills are limited but I think I am fairly typical of the sort of people who might be interested in this. I would be very happy if somebody pointed me to the report and data. If I try to interpret the BBC’s journalism, the argument goes something like this.

  1. The rise in cataract, knee and hip operations has “plateaued”.
  2. Need for such operations has not plateaued.
  3. That is evidence of a decreased tendency to perform such operations when needed.
  4. Such a decreased tendency is because of “rationing”.

Now there are a lot of unanswered questions and unsupported assertions behind 2, 3 and 4 but I want to focus on 1. What the researchers say is that the experience base showed a steady rise in operations but that ceased some time around 2008. In other words, since 2008 there has been a signal that something has changed over the historical data.

Signals are seldom straightforward to spot. As Nate Silver emphasises, signals need to be contrasted with, and understood in the context of, noise, the irregular variation that is common to the whole of the historical data. The problem with common cause variation is that it can lead us to be, as Nassim Taleb puts it, fooled by randomness.

Unfortunately, without the data, I cannot test this out on a process behaviour chart. Can I be persuaded that this data represents an increasing trend then a signal of a “plateau”?

The first question is whether there is a signal of a trend at all. I suspect that in this case there is if the data is plotted on a process behaviour chart. The next question is whether there is any variation in the slope of that trend. One simple approach to this is to fit a linear regression line through the data and put the residuals on a process behaviour chart. Only if there is a signal on the residuals chart is an inference of a “plateau” left open. Looking at the data my suspicion is that there would be no such signal.

More complex analyses are possible. One possibility would be to adjust the number of operations by a measure of population age then look at the stability and predictability of those numbers. However, I see no evidence of that analysis either.

I think that where anybody claims to have detected a signal, the legal maxim should prevail: He who asserts must prove. I see no evidence in the chart alone to support the assertion of a rising trend followed by a “plateau”.