W Edwards Deming exhorted us to eliminate exhortations.
I think that this video clip speaks for itself.

W Edwards Deming exhorted us to eliminate exhortations.
I think that this video clip speaks for itself.
I recently blogged about statistics of suicides on British railways here and here. Some very worthwhile programmes had been put in place with the objective of reducing these tragic deaths. However, my view at the point of my earlier posts was that this was a stable system of trouble, that there was neither a deteriorating trend nor any sign of improvement.
I now have the statistics for 2012/2013 to hand, released without any framing press notice. Here is the updated process behaviour chart.

Readers should note the following about the chart.
I fear that this is the tough discipline of the chart. It confronts us with current reality and deprives us of the opportunity to find comforting messages. Only a signal on the chart would be evidence of improvement. Statistics are not there to be selectively reported only when they fit our wishes and hopes. Statistics are to be charted, and reported, and discussed, and used as a basis for managing any operation; year in, year out.
Remember that in leading any operation the manager is confined to the retreating picture in the rearview mirror. Without the process behaviour chart, the manager is deprived even of that rear view.
It is a sad picture but improvement only comes from confronting current failure and finding new ways to intervene and redesign. Nobody will benefit from an ultimately vain quest for comforting messages.
By coincidence, this item appeared on the BBC today.
I chose a prosaic title because it’s not a subject about which levity is appropriate. I remain haunted by this cyclist on the level crossing. As a result I thought I would delve a little into railway accident statistics. The data is here. Unfortunately, the data only goes back to 2001/2002. This is a common feature of government data. There is no long term continuity in measurement to allow proper understanding of variation, trends and changes. All this encourages the “executive time series” that are familiar in press releases. I think that I shall call this political amnesia. When I have more time I shall look for a longer time series. The relevant department is usually helpful if contacted directly.
However, while I was searching I found this recent report on Railway Suicides in the UK: risk factors and prevention strategies. The report is by Kamaldeep Bhui and Jason Chalangary of the Wolfson Institute of Preventive Medicine, and Edgar Jones of the Institute of Psychiatry, King’s College, London. Originally, I didn’t intend to narrow my investigation to suicides but there were some things in the paper that bothered me and I felt were worth blogging about.
Obviously this is really important work. No civilised society is indifferent to tragedies such as suicide whose consequences are absorbed deeply into the community. The report analyses a wide base of theories and interventions concerning railway suicide risk. There is a lot of information and the authors have done an important job in bringing together and seeking conclusions. However, I was bothered by this passage (at p5).
The Rail Safety and Standards Board (RSSB) reported a progressive rise in suicides and suspected suicides from 192 in 2001-02 to a peak 233 in 2009-10, the total falling to 208 in 2010-11.
Oh dear! An “executive time series”. Let’s look at the data on a process behaviour chart.
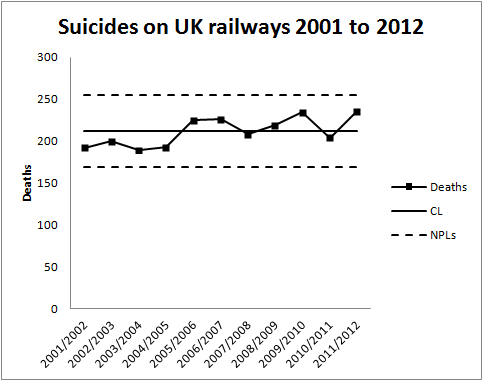
There is no signal, even ignoring the last observation in 2011/2012 which the authors had not had to hand. There has been no increasing propensity for suicide since 2001. The writers have been, as Nassim Taleb would put it, “fooled by randomness”. In the words of Nate Silver, they have confused signal and noise. The common cause variation in the data has been over interpreted by zealous and well meaning policy makers as an upward trend. However, all diligent risk managers know that interpretation of a chart is forbidden if there is no signal. Over interpretation will lead to (well meaning) over adjustment and admixture of even more variation into a stable system of trouble.
Looking at the development of the data over time I can understand that there will have been a temptation to perform a regression analysis and calculate a p-value for the perceived slope. This is an approach to avoid in general. It is beset with the dangers of testing effects suggested by the data and the general criticisms of p-values made by McCloskey and Ziliak. It is not a method that will be a reliable guide to future action. For what it’s worth I got a p-value of 0.015 for the slope but I am not impressed. I looked to see if I could find a pattern in the data then tested for the pattern my mind had created. It is unsurprising that it was “significant”.
The authors of the report go on to interpret the two figures for 2009/2010 (233 suicides) and 2010/2011 (208 suicides) as a “fall in suicides”. It is clear from the process behaviour chart that this is not a signal of a fall in suicides. It is simply noise, common cause variation from year to year.
Having misidentified this as a signal they go on to seek a cause. Of course they “find” a potential cause. A partnership between Network Rail and the Samaritans, Men on the Ropes, had started in January 2010. The programme’s aim was to reduce suicides by 20% over five years. I genuinely hope that the programme shows success. However, the programme will not be assisted by thinking that it has yet shown signs of improvement.
With the current mean annual total at 211, a 20% reduction entails a new mean of 169 annual suicides.That is an ambitious target I think, and I want to emphasise that the programme is entirely laudable and plausible. However, whether it succeeds is to be judged by the figures on the process behaviour chart, not by any post hoc rationalisation. This is the tough discipline of the charts. It is no longer possible to claim an improvement where that is not supported by the data.
I will come back to this data next year and look to see if there are any signs of encouragement.
I was recently looking on the web for any news on the Galicia rail crash. I didn’t find anything current but came across this old item from The Guardian (London). It mentioned in passing that consortia tendering for a new high speed railway in Brazil were excluded if they had been involved in the operation of a high speed line that had had an accident in the previous five years.
Well, I don’t think that there is necessarily anything wrong with that in itself. But it is important to remember that a rail accident is not necessarily a Signal (sic). Rail accidents worldwide are often a manifestation of what W Edwards Deming called A stable system of trouble. In other words, a system that features only Noise but which cannot deliver the desired performance. An accident free record of five years is a fine thing but there is nothing about a stable system of trouble that says it can’t have long incident free periods.
In order to turn that incident free five years into evidence about future likely safety performance we also need hard evidence, statistical and qualitative, about the stability and predictability of the rail operator’s processes. Procurement managers are often much worse at looking for, and at, this sort of data. In highly sophisticated industries such as automotive it is routine to demand capability data and evidence of process surveillance from a potential supplier. Without that, past performance is of no value whatever in predicting future results.
Rearview
thoughts on particle physics, statistics, and other stuff I find interesting and know something about
Strength in Numbers
"Statistical thinking will one day be as necessary for efficient citizenship as the ability to read and write." - H.G. Wells
Warning: "graphic" content...
... Anthony Cutler's blog on operational excellence and risk management
Ever tried. Ever failed. No matter. Try Again. Fail again. Fail better.
Accelerating Innovation in Harmony
A blog about Master Data Management, Product Information Management, Data Quality Management and more
... Anthony Cutler's blog on operational excellence and risk management
... Anthony Cutler's blog on operational excellence and risk management
... Anthony Cutler's blog on operational excellence and risk management
... Anthony Cutler's blog on operational excellence and risk management
... Anthony Cutler's blog on operational excellence and risk management
... Anthony Cutler's blog on operational excellence and risk management
The Undercover Economist
... Anthony Cutler's blog on operational excellence and risk management
... Anthony Cutler's blog on operational excellence and risk management
... Anthony Cutler's blog on operational excellence and risk management
... Anthony Cutler's blog on operational excellence and risk management
